Barclay-Kingston, NJ (New Jersey) Houses and Residents
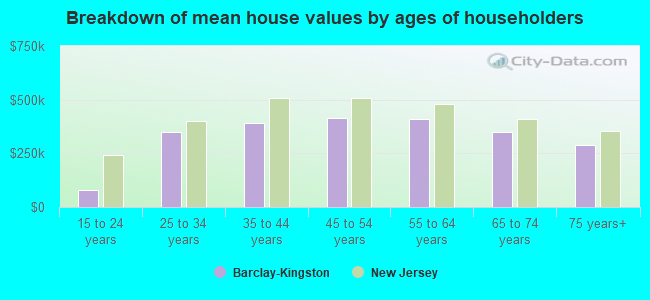
| Barclay-Kingston: | $360,174 |
| New Jersey: | $428,900 |
Total population: 10,937 (Urban population: 10,778, Rural population: 0)
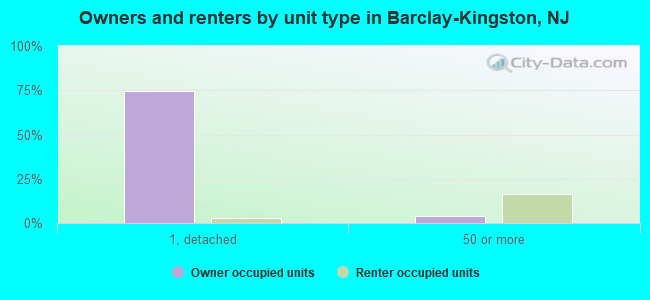
Houses: 4,203 (4,102 occupied: 3,305 owner occupied, 797 renter occupied)
| % of renters here: | 19% |
| State: | 35% |
Housing density: 1,475 houses/condos per square mile
Median price asked for vacant for-sale houses and condos in 2022 in this county: $280,676.
Median contract rent in 2022: $1,579 (lower quartile is $1,340, upper quartile is $1,797)
Median rent asked for vacant for-rent units in 2022: $1,499
Median gross rent in Barclay-Kingston, NJ in 2022: $1,597
Housing units in Barclay-Kingston with a mortgage: 2,075 (186 second mortgage, 362 home equity loan, 8 both second mortgage and home equity loan)
Houses without a mortgage: 974
Compare current foreclosures near Barclay-Kingston, NJ:
| Photo | Address | Area | Beds / Baths | Price | Details |
|---|---|---|---|---|---|

|
#1
Browning Rd
Merchantville, NJ 08109
|
2,376 sq. feet
|
3 baths 5 beds |
$469,900
|
show details |

|
#2
Pershing Ave
Darby, PA 19023
|
1,179 sq. feet
|
1 baths 3 beds |
$309,900
|
show details |

|
#3
Christian St
Philadelphia, PA 19146
|
1,612 sq. feet
|
2 baths 5 beds |
$449,900
|
show details |

|
#4
Jessamine Ave
Oaklyn, NJ 08107
|
864 sq. feet
|
2 baths 5 beds |
$389,900
|
show details |

|
#5
Edgewood Ave
Audubon, NJ 08106
|
1,250 sq. feet
|
1 baths 4 beds |
$375,000
|
show details |

|
#6
N Front St Apt B
Philadelphia, PA 19123
|
2,491 sq. feet
|
2 baths 3 beds |
$659,500
|
show details |

|
#7
N 59th St
Philadelphia, PA 19151
|
1,244 sq. feet
|
1 baths 3 beds |
$241,500
|
show details |

|
#8
Watson Blvd
Clementon, NJ 08021
|
1,268 sq. feet
|
1 baths 3 beds |
$289,900
|
show details |

|
#9
Yeadon Ave
Lansdowne, PA 19050
|
1,388 sq. feet
|
1 baths 3 beds |
$268,500
|
show details |

|
#10
N Cedar St
Bristol, PA 19007
|
841 sq. feet
|
1 baths 1 beds |
$307,500
|
show details |
| Photo | Address | Area | Beds / Baths | Price | Details |
|---|---|---|---|---|---|

|
#11
S 8th St
Philadelphia, PA 19148
|
1,170 sq. feet
|
1 baths 3 beds |
$168,500
|
show details |

|
#12
Mark Pl
Philadelphia, PA 19115
|
2,185 sq. feet
|
2 baths 4 beds |
$609,000
|
show details |

|
#13
Edwards Ave
Barrington, NJ 08007
|
1,112 sq. feet
|
1 baths 3 beds |
$325,500
|
show details |

|
#14
Ashbourne Rd
Elkins Park, PA 19027
|
3,104 sq. feet
|
3 baths 6 beds |
$154,500
|
show details |

|
#15
W Oakdale Street
Philadelphia, PA 19132
|
1,152 sq. feet
|
2 baths 3 beds |
$108,900
|
show details |

|
#16
N 5th St
Philadelphia, PA 19126
|
1,420 sq. feet
|
2 baths 3 beds |
$313,900
|
show details |

|
#17
Manor Ln
Willingboro, NJ 08046
|
1,576 sq. feet
|
2 baths 3 beds |
$390,000
|
show details |

|
#18
Cooper St
Woodbury, NJ 08096
|
936 sq. feet
|
1 baths 3 beds |
$255,000
|
show details |

|
#19
Foxglove Dr
Riverside, NJ 08075
|
840 sq. feet
|
1 baths 2 beds |
$113,683
|
show details |

|
#20
Manchester Rd
Elkins Park, PA 19027
|
3,444 sq. feet
|
2 baths 3 beds |
$548,900
|
show details |
| Photo | Address | Area | Beds / Baths | Price | Details |
|---|---|---|---|---|---|

|
#21
Covered Bridge Rd
Cherry Hill, NJ 08034
|
1,343 sq. feet
|
1 baths 3 beds |
$450,000
|
show details |

|
#22
Kershaw St
Philadelphia, PA 19131
|
1,284 sq. feet
|
1 baths 3 beds |
$134,500
|
show details |

|
#23
Harvey Ave
Pennsauken, NJ 08110
|
1,555 sq. feet
|
2 baths 4 beds |
$415,000
|
show details |

|
#24
67th Ave
Philadelphia, PA 19138
|
1,146 sq. feet
|
1 baths 3 beds |
$8,900
|
show details |

|
#25
Keenan St
Elkins Park, PA 19027
|
1,234 sq. feet
|
2 baths 2 beds |
$217,220
|
show details |

|
#26
Windermere Ave
Drexel Hill, PA 19026
|
- sq. feet
|
2 baths 3 beds |
$218,400
|
show details |

|
#27
E Wishart St
Philadelphia, PA 19134
|
1,064 sq. feet
|
1 baths 3 beds |
$1,290,613
|
show details |

|
#28
Brookhurst Ave
Narberth, PA 19072
|
1,764 sq. feet
|
1 baths 3 beds |
$352,798
|
show details |

|
#29
Presidential Blvd Unit 915b
Bala Cynwyd, PA 19004
|
579 sq. feet
|
1 baths 1 beds |
$104,531
|
show details |

|
#30
44th St
Pennsauken, NJ 08110
|
- sq. feet
|
1 baths 3 beds |
$94,900
|
show details |
| Photo | Address | Area | Beds / Baths | Price | Details |
|---|---|---|---|---|---|

|
#31
W Oakdale St
Philadelphia, PA 19132
|
1,134 sq. feet
|
1 baths 3 beds |
$1,322,645
|
show details |

|
#32
Pickering St
Philadelphia, PA 19150
|
1,170 sq. feet
|
1 baths 3 beds |
$169,900
|
show details |

|
#33
E Courtland St
Philadelphia, PA 19120
|
800 sq. feet
|
1 baths 3 beds |
$76,008
|
show details |

|
#34
N Newkirk St
Philadelphia, PA 19132
|
960 sq. feet
|
1 baths 3 beds |
$1,128,765
|
show details |

|
#35
State St
Camden, NJ 08102
|
2,068 sq. feet
|
2 baths 5 beds |
show details | |

|
#36
Folcroft Ave
Folcroft, PA 19032
|
1,722 sq. feet
|
2 baths 4 beds |
show details | |

|
#37
Cope St
Camden, NJ 08104
|
1,084 sq. feet
|
1 baths 3 beds |
show details | |

|
#38
Fern St
Lansdowne, PA 19050
|
1,982 sq. feet
|
3 baths 3 beds |
show details | |

|
#39
N Franklin St # 4
Philadelphia, PA 19122
|
2,184 sq. feet
|
2 baths 3 beds |
show details | |

|
#40
N 18th St
Philadelphia, PA 19126
|
1,320 sq. feet
|
1 baths 3 beds |
show details |
| Photo | Address | Area | Beds / Baths | Price | Details |
|---|---|---|---|---|---|

|
#41
Griscom St
Philadelphia, PA 19124
|
1,552 sq. feet
|
1 baths 3 beds |
show details | |

|
#42
Hoffman Ave
Philadelphia, PA 19143
|
1,040 sq. feet
|
1 baths 3 beds |
show details | |

|
#43
Dyre St
Philadelphia, PA 19124
|
1,976 sq. feet
|
1 baths 4 beds |
show details | |

|
#44
E Somerset St
Philadelphia, PA 19134
|
1,282 sq. feet
|
1 baths 3 beds |
show details | |

|
#45
E Somerset St
Philadelphia, PA 19134
|
1,136 sq. feet
|
1 baths 3 beds |
show details | |

|
#46
Erdrick St
Philadelphia, PA 19135
|
1,160 sq. feet
|
1 baths 3 beds |
show details | |

|
#47
Spring Ave
Elkins Park, PA 19027
|
1,224 sq. feet
|
2 baths 3 beds |
show details | |

|
#48
Hart Ln
Philadelphia, PA 19134
|
940 sq. feet
|
1 baths 3 beds |
show details | |

|
#49
Hawthorne St
Philadelphia, PA 19124
|
1,332 sq. feet
|
1 baths 3 beds |
show details | |

|
Check over 1 million property listings on Foreclosure.com!
|
browse all offers | |||

 | Cherry Hill- Barclay-Kingston or Erlton-Ellisburg sections? (3 replies) |
Household type by relationship:
Households: 506,243- In family households: 431,734 (82,185 male householders, 47,758 female householders)
88,462 spouses, 162,028 children (152,370 natural, 3,447 adopted, 6,211 stepchildren), 13,516 grandchildren, 6,342 brothers or sisters, 5,878 parents, foster children, 8,583 other relatives, 13,287 non-relatives
- In nonfamily households: 74,509 (26,856 male householders (20,736 living alone)), 34,181 female householders (29,446 living alone)), 13,472 nonrelatives
- In group quarters: 7,414 (5,604 institutionalized population)
84,681 married couples with children.
35,421 single-parent households (6,804 men, 28,617 women).
88.3% of residents of Barclay-Kingston speak English at home.
1.3% of residents speak Spanish at home (71% speak English very well, 23% speak English well, 6% speak English not well).
4.0% of residents speak other Indo-European language at home (75% speak English very well, 17% speak English well, 9% speak English not well).
5.4% of residents speak Asian or Pacific Island language at home (75% speak English very well, 23% speak English well, 2% speak English not well).
1.0% of residents speak other language at home (61% speak English very well, 39% speak English well).
Foreign born population: 1,786 (16.1%)
(82.4% of them are naturalized citizens)
| Here: | 8.2 |
| State: | 6.8 |
| Here: | 4.0 |
| State: | 3.9 |
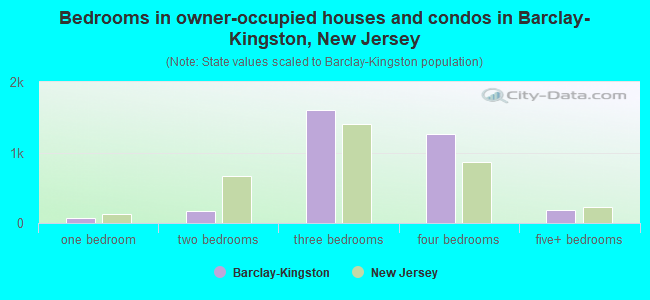
- Bedrooms in owner-occupied houses and condos in Barclay-Kingston, New Jersey
- 0no bedroom
- 771 bedroom
- 1772 bedrooms
- 1,6013 bedrooms
- 1,2624 bedrooms
- 1885+ bedrooms
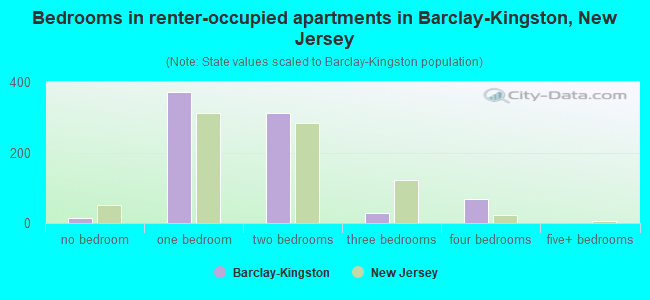
- Bedrooms in renter-occupied apartments in Barclay-Kingston, New Jersey
- 15no bedroom
- 3731 bedroom
- 3122 bedrooms
- 283 bedrooms
- 694 bedrooms
- 05+ bedrooms
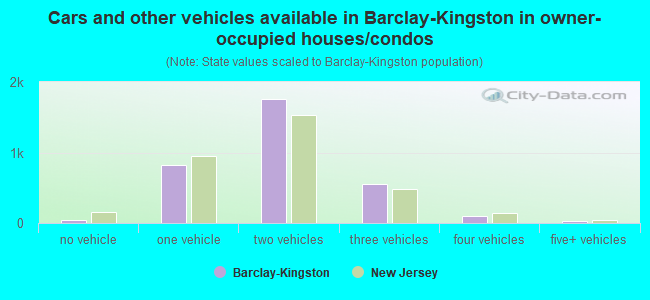
- Cars and other vehicles available in Barclay-Kingston in owner-occupied houses/condos
- 46no vehicle
- 8261 vehicle
- 1,7542 vehicles
- 5573 vehicles
- 964 vehicles
- 265+ vehicles
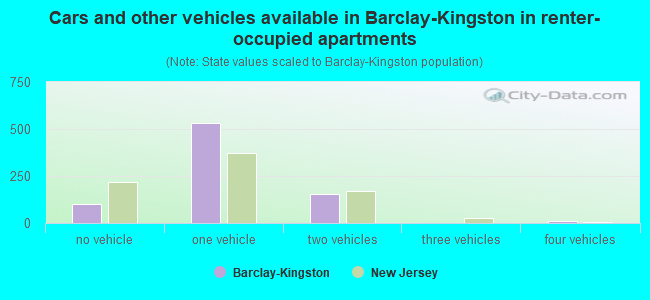
- Cars and other vehicles available in Barclay-Kingston in renter-occupied apartments
- 100no vehicle
- 5311 vehicle
- 1562 vehicles
- 03 vehicles
- 104 vehicles
- 05+ vehicles
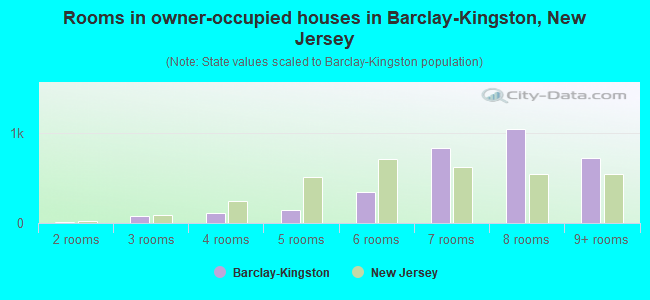
- Rooms in owner-occupied houses in Barclay-Kingston, New Jersey
- 01 room
- 102 rooms
- 783 rooms
- 1154 rooms
- 1495 rooms
- 3466 rooms
- 8377 rooms
- 1,0458 rooms
- 7259+ rooms
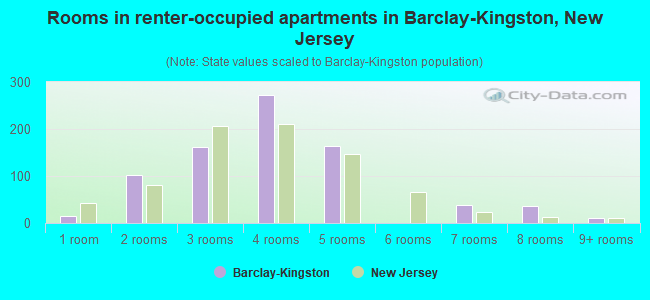
- Rooms in renter-occupied apartments in Barclay-Kingston, New Jersey
- 151 room
- 1022 rooms
- 1613 rooms
- 2724 rooms
- 1635 rooms
- 06 rooms
- 387 rooms
- 368 rooms
- 109+ rooms
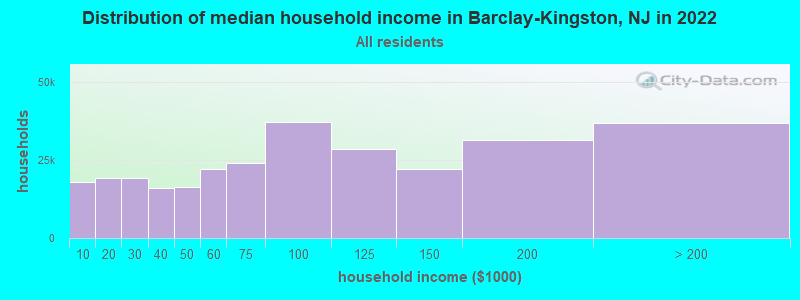
Barclay-Kingston, NJ household income distribution

- 17,843Less than $10,000
- 19,170$10,000 to $19,999
- 19,116$20,000 to $29,999
- 16,109$30,000 to $39,999
- 16,313$40,000 to $49,999
- 22,071$50,000 to $59,999
- 23,919$60,000 to $74,999
- 37,084$75,000 to $99,999
- 28,569$100,000 to $124,999
- 21,944$125,000 to $149,999
- 31,254$150,000 to $199,999
- 36,736$200,000 or more
Percentage of workers working in this county: 53.1%
Number of people working at home: 872 (14.7% of all workers)
Travel time to work (commute)
- Less than 5 minutes: 77
- 5 to 9 minutes: 497
- 10 to 14 minutes: 1,017
- 15 to 19 minutes: 980
- 20 to 24 minutes: 729
- 25 to 29 minutes: 256
- 30 to 34 minutes: 477
- 35 to 39 minutes: 95
- 40 to 44 minutes: 172
- 45 to 59 minutes: 330
- 60 to 89 minutes: 345
- 90 or more minutes: 73
Means of transportation to work:
- Drove a car alone: 4,204 (79.6%)
- Carpooled: 400 (7.6%)
- Bus or trolley bus: 44 (0.8%)
- Subway or elevated: 216 (4.1%)
- Railroad: 113 (2.1%)
- Walked: 71 (1.3%)
- Worked at home: 236 (4.5%)
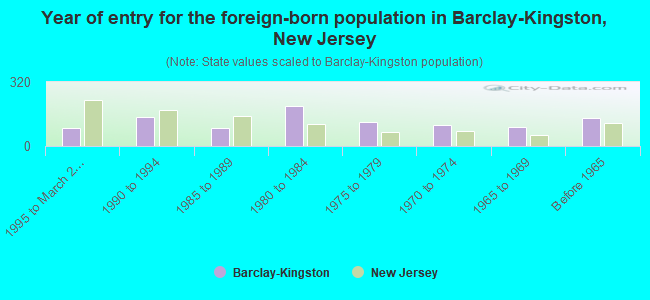
- Year of entry for the foreign-born population in Barclay-Kingston, New Jersey
- 921995 to March 2000
- 1441990 to 1994
- 921985 to 1989
- 1981980 to 1984
- 1211975 to 1979
- 1051970 to 1974
- 961965 to 1969
- 138Before 1965
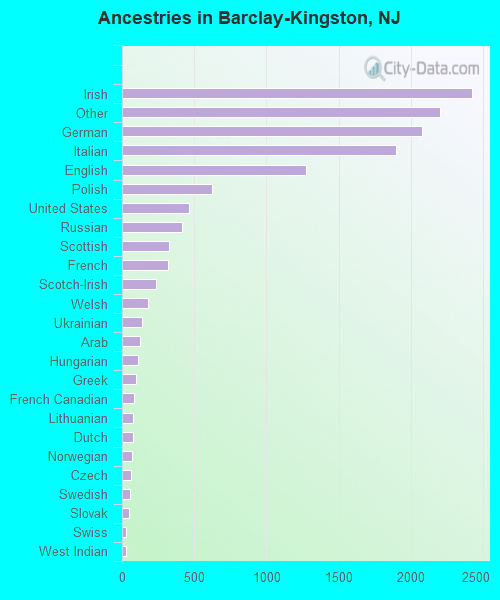
First ancestries reported:
- Irish: 2,420 (18.0%)
- Other: 2,201 (16.4%)
- German: 2,077 (15.5%)
- Italian: 1,895 (14.1%)
- English: 1,275 (9.5%)
- Polish: 623 (4.6%)
- United States: 462 (3.4%)
- Russian: 413 (3.1%)
- Scottish: 324 (2.4%)
- French: 318 (2.4%)
- Scotch-Irish: 233 (1.7%)
- Welsh: 178 (1.3%)
- Ukrainian: 136 (1.0%)
- Arab: 125 (0.9%)
- Hungarian: 114 (0.8%)
- Greek: 94 (0.7%)
- French Canadian: 85 (0.6%)
- Lithuanian: 78 (0.6%)
- Dutch: 73 (0.5%)
- Norwegian: 68 (0.5%)
- Czech: 64 (0.5%)
- Swedish: 52 (0.4%)
- Slovak: 47 (0.4%)
- Swiss: 26 (0.2%)
- West Indian: 25 (0.2%)
- Subsaharan African: 14 (0.1%)
- Danish: 6 (0.04%)
Most common places of birth for foreign-born residents (%):
| Barclay-Kingston: | 33.2% (327) |
| New Jersey: | 4.7% (69,773) |
| Barclay-Kingston: | 7.7% (76) |
| New Jersey: | 8.1% (119,497) |
| Barclay-Kingston: | 6.4% (63) |
| New Jersey: | 3.5% (51,970) |
| Barclay-Kingston: | 4.9% (48) |
| New Jersey: | 1.1% (16,333) |
| Barclay-Kingston: | 4.3% (42) |
| New Jersey: | 0.8% (12,403) |
| Barclay-Kingston: | 4.0% (39) |
| New Jersey: | 1.2% (18,066) |
| Barclay-Kingston: | 3.4% (34) |
| New Jersey: | 2.1% (30,355) |
| Barclay-Kingston: | 3.2% (32) |
| New Jersey: | 0.2% (3,320) |
| Barclay-Kingston: | 2.7% (27) |
| New Jersey: | 0.2% (3,548) |
| Barclay-Kingston: | 2.7% (27) |
| New Jersey: | 2.3% (33,531) |
| Barclay-Kingston: | 2.6% (26) |
| New Jersey: | 0.9% (13,337) |
| Barclay-Kingston: | 2.5% (25) |
| New Jersey: | 1.4% (20,243) |
| Barclay-Kingston: | 1.9% (19) |
| New Jersey: | 2.7% (40,092) |
| Barclay-Kingston: | 1.7% (17) |
| New Jersey: | 1.1% (16,052) |
| Barclay-Kingston: | 1.7% (17) |
| New Jersey: | 0.3% (4,774) |
| Barclay-Kingston: | 1.6% (16) |
| New Jersey: | 4.0% (58,395) |
| Barclay-Kingston: | 1.5% (15) |
| New Jersey: | 0.4% (5,929) |
Place of birth for U.S.-born residents:
- This state: 3,985
- Other state: 5,715
- Northeast: 4,721
- Midwest: 290
- South: 530
- West: 174
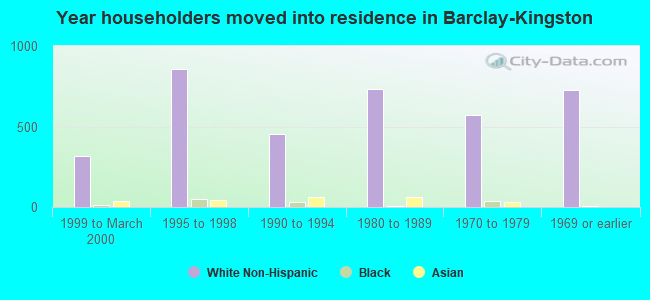
67% of Barclay-Kingston residents lived in the same house 5 years ago.
Out of people who lived in different houses, 61% lived in this county.
Out of people who lived in different counties, 49% lived in New Jersey.
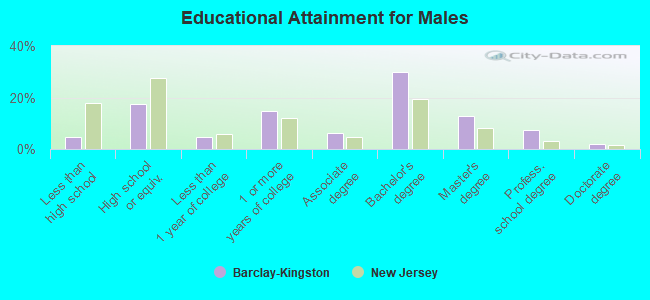
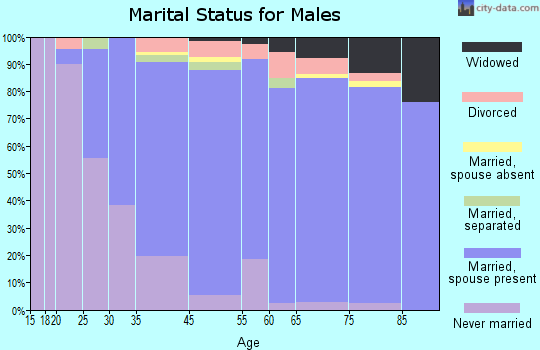
Education attainment for males 25 years and older:
- No schooling: 7
- Nursery to 4th grade: 0
- 5th and 6th grade: 11
- 7th and 8th grade: 14
- 9th grade: 36
- 10th grade: 9
- 11th grade: 28
- 12th grade, no diploma: 63
- High school graduate (or equivalency): 607
- Less than 1 year of college: 167
- Some college more than 1 year, no degree: 517
- Associate degree: 219
- Bachelor's degree: 1,054
- Master's degree: 449
- Professional school degree: 260
- Doctorate degree: 66
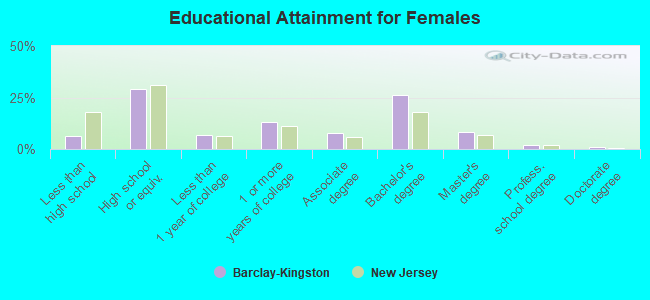
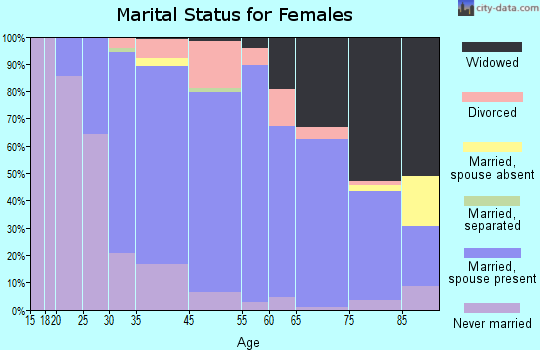
Education attainment for females 25 years and older:
- No schooling: 10
- Nursery to 4th grade: 7
- 5th and 6th grade: 13
- 7th and 8th grade: 22
- 9th grade: 6
- 10th grade: 70
- 11th grade: 45
- 12th grade, no diploma: 84
- High school graduate (or equivalency): 1,170
- Less than 1 year of college: 272
- Some college more than 1 year, no degree: 525
- Associate degree: 320
- Bachelor's degree: 1,053
- Master's degree: 323
- Professional school degree: 72
- Doctorate degree: 34
Housing units in structures:
- One, detached: 3,209
- One, attached: 36
- Two: 7
- 3 or 4: 9
- 5 to 9: 27
- 10 to 19: 15
- 50 or more: 900
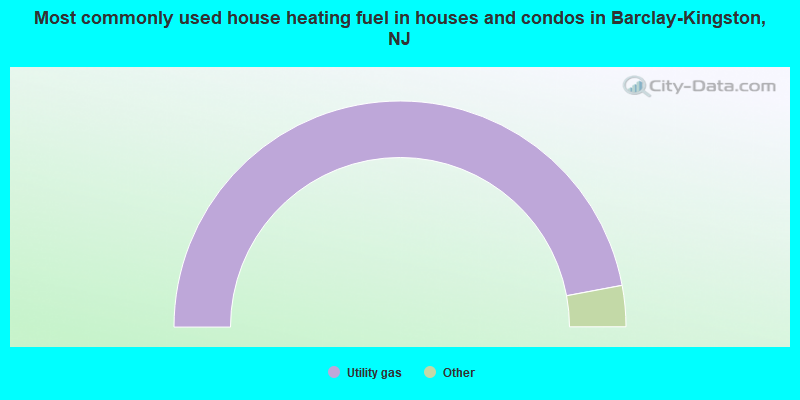
- 94.1%Utility gas
- 3.0%Fuel oil, kerosene, etc.
- 1.5%Electricity
- 0.7%Bottled, tank, or LP gas
- 0.4%Wood
- 0.3%Other fuel
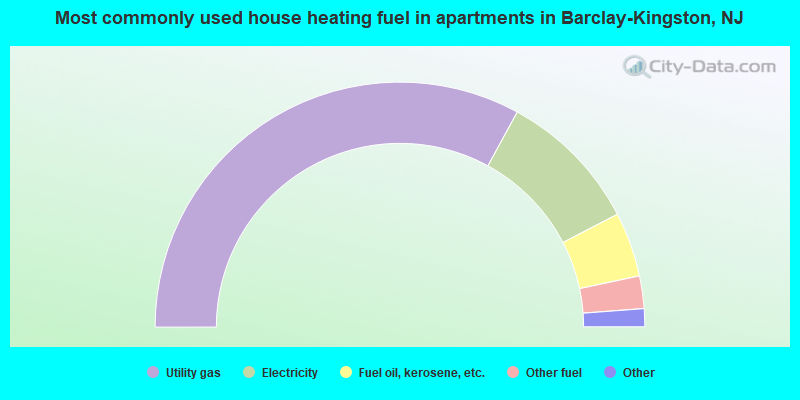
- 65.9%Utility gas
- 18.9%Electricity
- 8.5%Fuel oil, kerosene, etc.
- 4.3%Other fuel
- 1.3%Coal or coke
- 1.1%No fuel used
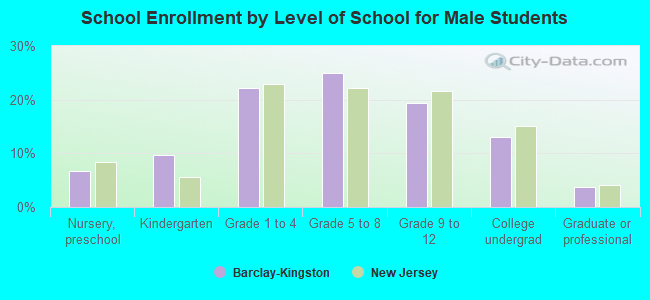
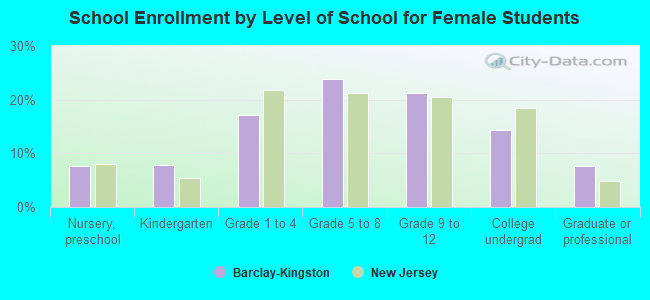
Private vs. public school enrollment:
| Here: | 12.4% |
| New Jersey: | 13.2% |
| Here: | 16.0% |
| New Jersey: | 13.0% |
| Here: | 41.8% |
| New Jersey: | 30.1% |