Archdale, NC (North Carolina) Houses and Residents
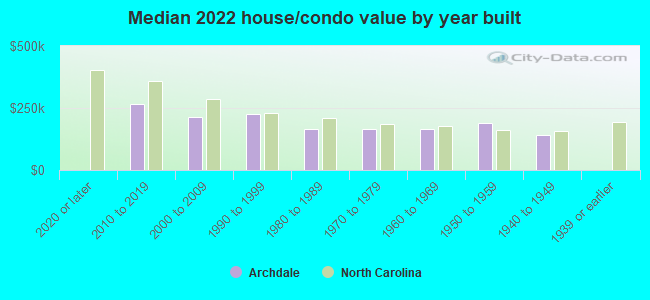
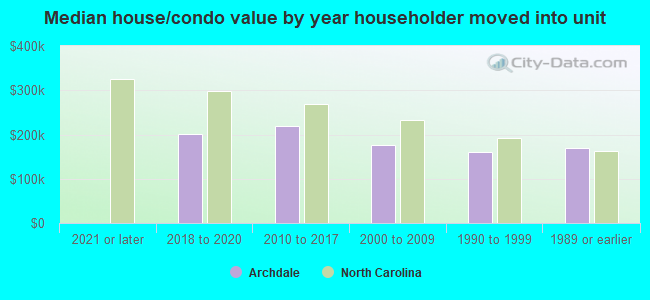
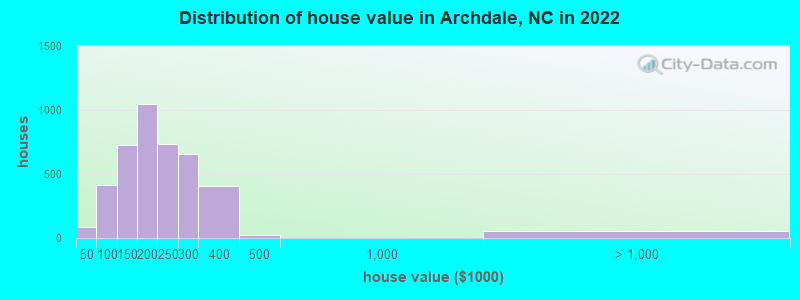
Estimated median house or condo value in 2022: $185,999 (it was $97,800 in 2000 )
Archdale:
$185,999North Carolina:
$280,600
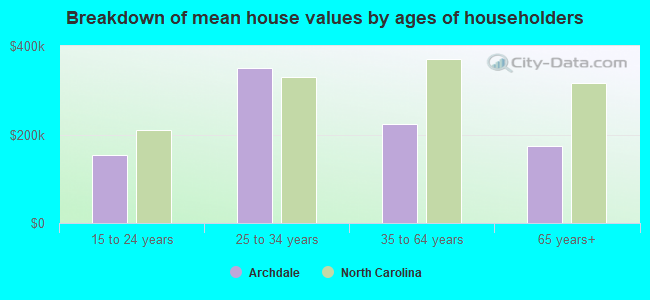
Lower value quartile - upper value quartile: $140,156 - $261,954Mean price in 2022: Detached houses: $277,781 Here:
$277,781State:
$375,326
Townhouses or other attached units: $219,370 Here:
$219,370State:
$317,935
In 3-to-4-unit structures: $644,246 Here:
$644,246State:
$254,939
In 5-or-more-unit structures: $156,478 Here:
$156,478State:
$329,290
Mobile homes: $115,860 Here:
$115,860State:
$124,933
Total population: 11,539 (Urban population: 8,987, Rural population: 28 (18 farm, 10 nonfarm ))
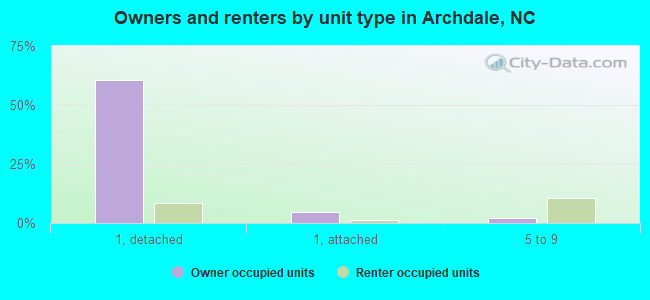
Houses: 4,950 (4,670 occupied: 3,935 owner occupied, 877 renter occupied )
% of renters here:
18%State:
33%
Housing density: 633 houses/condos per square mile
Median price asked for vacant for-sale houses and condos in 2022: $239,234.
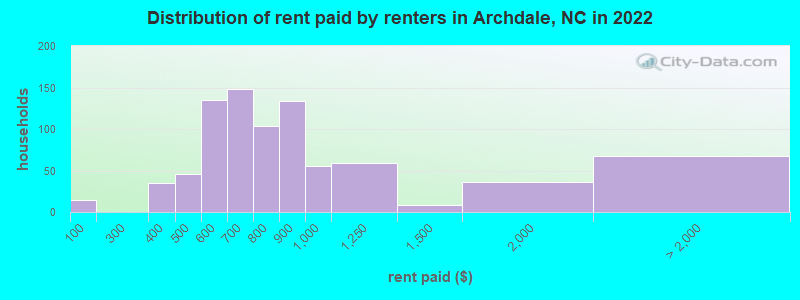
Median contract rent in 2022: $724 (lower quartile is $580, upper quartile is $860)
Median rent asked for vacant for-rent units in 2022: $725
Median gross rent in Archdale, NC in 2022: $885
Housing units in Archdale with a mortgage: 2,551 (262 second mortgage, 0 home equity loan, 263 both second mortgage and home equity loan )Houses without a mortgage: 40
Median household income for houses/condos with a mortgage: $71,911
Median household income for apartments without a mortgage: $58,855
Median monthly housing costs: $899
Data:
Median house or condo value ($)
Median house or condo value ($ change since 2000)
Median house or condo value ($) - White
Median house or condo value ($) - Black or African American
Median house or condo value ($) - Asian
Median house or condo value ($) - Hispanic or Latino
Median house or condo value ($) - American Indian and Alaska Native
Median house or condo value ($) - Multirace
Median house or condo value ($) - Other Race
Median price asked for mobile homes ($)
Household density (households per square mile)
Mean house or condo value by units in structure - 1, detached ($)
Mean house or condo value by units in structure - 1, attached ($)
Mean house or condo value by units in structure - 2 ($)
Mean house or condo value by units in structure by units in structure - 3 or 4 ($)
Mean house or condo value by units in structure - 5 or more ($)
Mean house or condo value by units in structure - Boat, RV, van, etc. ($)
Mean house or condo value by units in structure - Mobile home ($)
Median contract rent ($)
Median contract rent - Lower quartile ($)
Median contract rent - Upper quartile ($)
Median gross rent ($)
Urban houses (%)
Rural houses (%)
Houses occupied (%)
Houses occupied (% change since 2000)
Houses owner occupied (%)
Houses owner occupied (% change since 2000)
Houses renter occupied (%)
Houses renter occupied (% change since 2000)
Vacant housing units - For rent (%)
Vacant housing units - For rent (% change since 2000)
Vacant housing units - For sale only (%)
Vacant housing units - For sale only (% change since 2000)
Vacant housing units - Rented or sold, not occupied (%)
Vacant housing units - Rented or sold, not occupied (% change since 2000)
Vacant housing units - For seasonal, recreational, or occasional use (%)
Vacant housing units - For seasonal, recreational, or occasional use (% change since 2000)
Vacant housing units - For migrant workers (%)
Vacant housing units - For migrant workers (% change since 2000)
Vacant housing units - Other vacant (%)
Vacant housing units - Other vacant (% change since 2000)
Median monthly housing costs ($)
Median household income for houses/condos with a mortgage ($)
Median household income for houses/condos without a mortgage ($)
Median household income ($)
Median household income ($) - White
Median household income ($) - Black or African American
Median household income ($) - Asian
Median household income ($) - Hispanic or Latino
Median household income ($) - American Indian and Alaska Native
Median household income ($) - Multirace
Median household income ($) - Other Race
Mortgage status - with mortgage (%)
Mortgage status - with second mortgage (%)
Mortgage status - with home equity loan (%)
Mortgage status - with both second mortgage and home equity loan (%)
Mortgage status - without a mortgage (%)
Median year house/condo built
Median year apartment built
Household type by relationship - Male householder living alone (%)
Household type by relationship - Male householder not living alone (%)
Household type by relationship - Female householder living alone (%)
Household type by relationship - Female householder not living alone (%)
Household type by relationship - Opposite-Sex spouse (%)
Household type by relationship - Same-Sex spouse (%)
Household type by relationship - Opposite-Sex unmarried partner (%)
Household type by relationship - Same-Sex unmarried partner (%)
Household type by relationship - In group quarters (%)
Size of family households - 2-person household (%)
Size of family households - 3-person household (%)
Size of family households - 4-person household (%)
Size of family households - 5-person household (%)
Size of family households - 6-person household (%)
Size of family households - 7-or-more-person household (%)
Size of nonfamily households - 1-person household (%)
Size of nonfamily households - 2-person household (%)
Size of nonfamily households - 3-person household (%)
Size of nonfamily households - 4-person household (%)
Size of nonfamily households - 5-person household (%)
Size of nonfamily households - 6-person household (%)
Size of nonfamily households - 7-or-moreperson household (%)
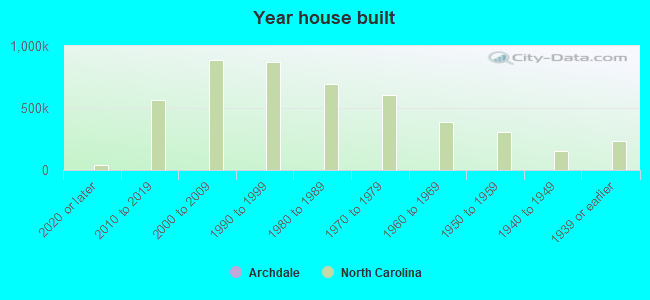
Year house built - Built 2010 or later (%)
Year house built - Built 2000 to 2009 (%)
Year house built - Built 1990 to 1999 (%)
Year house built - Built 1980 to 1989 (%)
Year house built - Built 1970 to 1979 (%)
Year house built - Built 1960 to 1969 (%)
Year house built - Built 1950 to 1959 (%)
Year house built - Built 1940 to 1949 (%)
Year house built - Built 1939 or earlier (%)
Median number of rooms in houses and condos
Median number of rooms in apartments
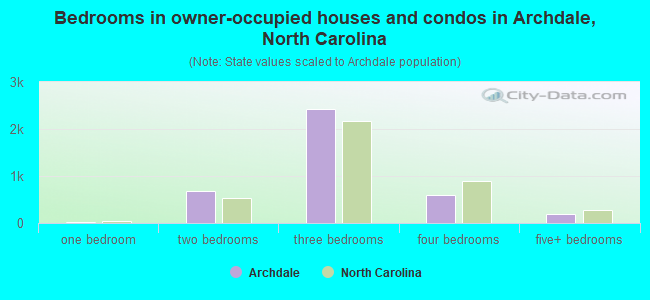
Median number of bedrooms in owner occupied houses
Mean number of bedrooms in owner occupied houses
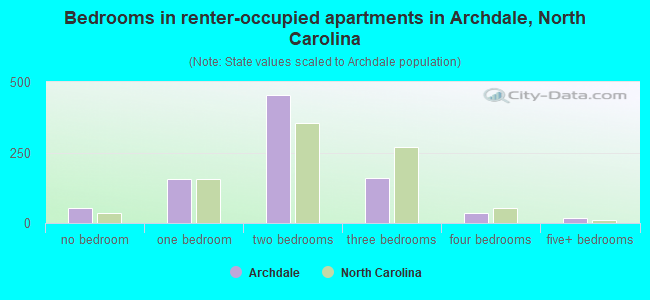
Median number of bedrooms in renter occupied houses
Mean number of bedrooms in renter occupied houses
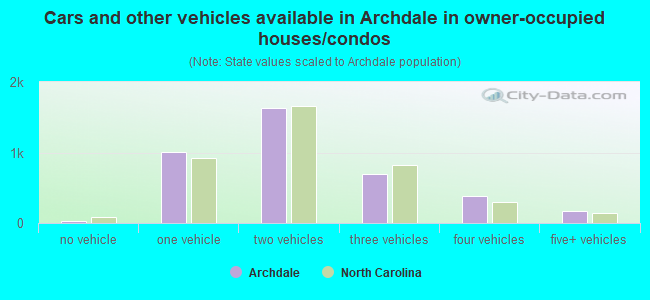
Median number of vehichles in owner occupied houses
Mean number of vehichles in owner occupied houses
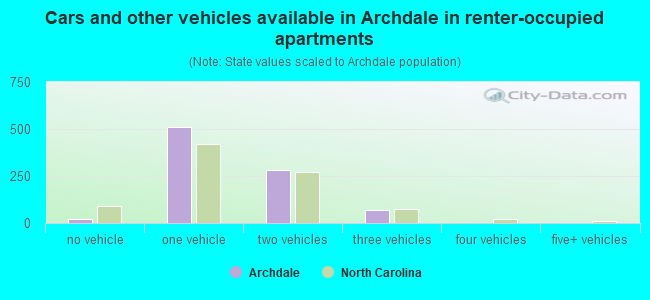
Median number of vehichles in renter occupied houses
Mean number of vehichles in renter occupied houses
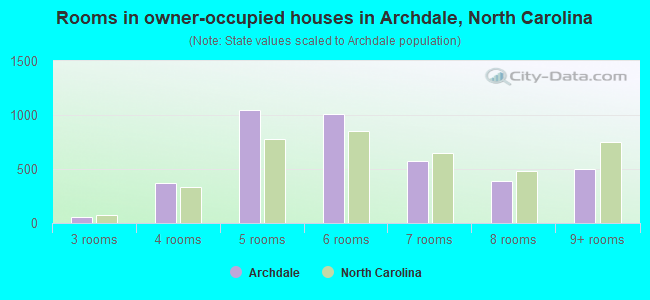
Rooms in owner-occupied houses - 1 room (%)
Rooms in owner-occupied houses - 2 rooms (%)
Rooms in owner-occupied houses - 3 rooms (%)
Rooms in owner-occupied houses - 4 rooms (%)
Rooms in owner-occupied houses - 5 rooms (%)
Rooms in owner-occupied houses - 6 rooms (%)
Rooms in owner-occupied houses - 7 rooms (%)
Rooms in owner-occupied houses - 8 rooms (%)
Rooms in owner-occupied houses - 9+ rooms (%)
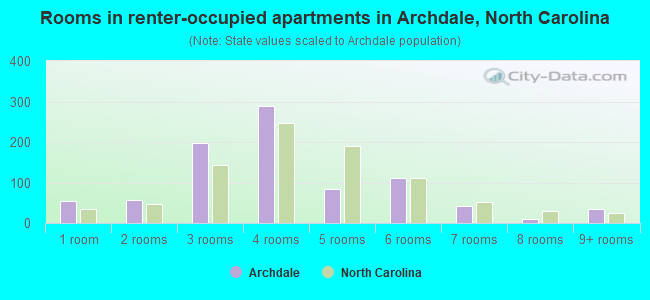
Rooms in renter-occupied houses - 1 room (%)
Rooms in renter-occupied houses - 2 rooms (%)
Rooms in renter-occupied houses - 3 rooms (%)
Rooms in renter-occupied houses - 4 rooms (%)
Rooms in renter-occupied houses - 5 rooms (%)
Rooms in renter-occupied houses - 6 rooms (%)
Rooms in renter-occupied houses - 7 rooms (%)
Rooms in renter-occupied houses - 8 rooms (%)
Rooms in renter-occupied houses - 9+ rooms (%)
Bedrooms in owner-occupied houses - no bedrooms (%)
Bedrooms in owner-occupied houses - 1 bedroom (%)
Bedrooms in owner-occupied houses - 2 bedrooms (%)
Bedrooms in owner-occupied houses - 3 bedrooms (%)
Bedrooms in owner-occupied houses - 4 bedrooms (%)
Bedrooms in owner-occupied houses - 5+ bedrooms (%)
Bedrooms in renter-occupied houses - no bedrooms (%)
Bedrooms in renter-occupied houses - 1 bedroom (%)
Bedrooms in renter-occupied houses - 2 bedrooms (%)
Bedrooms in renter-occupied houses - 3 bedrooms (%)
Bedrooms in renter-occupied houses - 4 bedrooms (%)
Bedrooms in renter-occupied houses - 5+ bedrooms (%)
Vehicles available in owner-occupied houses - no vehicle available (%)
Vehicles available in owner-occupied houses - 1 vehicle available(%)
Vehicles available in owner-occupied houses - 2 Vehicles available (%)
Vehicles available in owner-occupied houses - 3 Vehicles available (%)
Vehicles available in owner-occupied houses - 4 Vehicles available (%)
Vehicles available in owner-occupied houses - 5+ Vehicles available (%)
Vehicles available in renter-occupied houses - no vehicle available (%)
Vehicles available in renter-occupied houses - 1 vehicle available (%)
Vehicles available in renter-occupied houses - 2 Vehicles available (%)
Vehicles available in renter-occupied houses - 3 Vehicles available (%)
Vehicles available in renter-occupied houses - 4 Vehicles available (%)
Vehicles available in renter-occupied houses - 5+ Vehicles available (%)
Housing units in structures - 1, detached (%)
Housing units in structures - 1, attached (%)
Housing units in structures - 2 (%)
Housing units in structures - 3 or 4 (%)
Housing units in structures - 5 to 9 (%)
Housing units in structures - 10 to 19 (%)
Housing units in structures - 20 to 49 (%)
Housing units in structures - 50 or more (%)
Housing units in structures - Mobile home (%)
Housing units in structures - Boat, RV, van, etc. (%)
Housing units in structures - Owners - 1, detached (%)
Housing units in structures - Owners - 1, attached (%)
Housing units in structures - Owners - 2 (%)
Housing units in structures - Owners - 3 or 4 (%)
Housing units in structures - Owners - 5 to 9 (%)
Housing units in structures - Owners - 10 to 19 (%)
Housing units in structures - Owners - 20 to 49 (%)
Housing units in structures - Owners - 50 or more (%)
Housing units in structures - Owners - Mobile home (%)
Housing units in structures - Owners - Boat, RV, van, etc. (%)
Housing units in structures - Renters - 1, detached (%)
Housing units in structures - Renters - 1, attached (%)
Housing units in structures - Renters - 2 (%)
Housing units in structures - Renters - 3 or 4 (%)
Housing units in structures - Renters - 5 to 9 (%)
Housing units in structures - Renters - 10 to 19 (%)
Housing units in structures - Renters - 20 to 49 (%)
Housing units in structures - Renters - 50 or more (%)
Housing units in structures - Renters - Mobile home (%)
Housing units in structures - Renters - Boat, RV, van, etc. (%)
House/condo owner moved in on average (years ago)
Renter moved in on average (years ago)
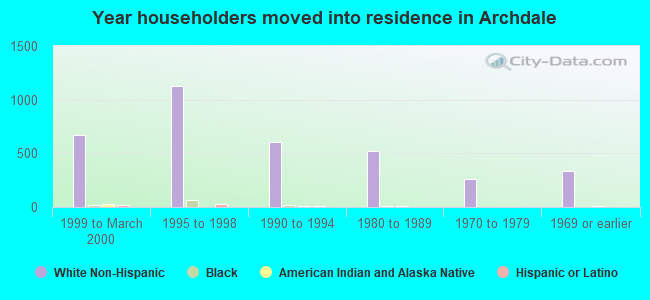
Year householder moved into unit - Moved in 1999 to March 2000 (%)
Year householder moved into unit - Moved in 1999 to March 2000 (%) - White
Year householder moved into unit - Moved in 1999 to March 2000 (%) - Black or African American
Year householder moved into unit - Moved in 1999 to March 2000 (%) - Asian
Year householder moved into unit - Moved in 1999 to March 2000 (%) - Hispanic or Latino
Year householder moved into unit - Moved in 1999 to March 2000 (%) - American Indian and Alaska Native
Year householder moved into unit - Moved in 1999 to March 2000 (%) - Multirace
Year householder moved into unit - Moved in 1999 to March 2000 (%) - Other Race
Year householder moved into unit - Moved in 1995 to 1998 (%)
Year householder moved into unit - Moved in 1995 to 1998 (%) - White
Year householder moved into unit - Moved in 1995 to 1998 (%) - Black or African American
Year householder moved into unit - Moved in 1995 to 1998 (%) - Asian
Year householder moved into unit - Moved in 1995 to 1998 (%) - Hispanic or Latino
Year householder moved into unit - Moved in 1995 to 1998 (%) - American Indian and Alaska Native
Year householder moved into unit - Moved in 1995 to 1998 (%) - Multirace
Year householder moved into unit - Moved in 1995 to 1998 (%) - Other Race
Year householder moved into unit - Moved in 1990 to 1994 (%)
Year householder moved into unit - Moved in 1990 to 1994 (%) - White
Year householder moved into unit - Moved in 1990 to 1994 (%) - Black or African American
Year householder moved into unit - Moved in 1990 to 1994 (%) - Asian
Year householder moved into unit - Moved in 1990 to 1994 (%) - Hispanic or Latino
Year householder moved into unit - Moved in 1990 to 1994 (%) - American Indian and Alaska Native
Year householder moved into unit - Moved in 1990 to 1994 (%) - Multirace
Year householder moved into unit - Moved in 1990 to 1994 (%) - Other Race
Year householder moved into unit - Moved in 1980 to 1989 (%)
Year householder moved into unit - Moved in 1980 to 1989 (%) - White
Year householder moved into unit - Moved in 1980 to 1989 (%) - Black or African American
Year householder moved into unit - Moved in 1980 to 1989 (%) - Asian
Year householder moved into unit - Moved in 1980 to 1989 (%) - Hispanic or Latino
Year householder moved into unit - Moved in 1980 to 1989 (%) - American Indian and Alaska Native
Year householder moved into unit - Moved in 1980 to 1989 (%) - Multirace
Year householder moved into unit - Moved in 1980 to 1989 (%) - Other Race
Year householder moved into unit - Moved in 1970 to 1979 (%)
Year householder moved into unit - Moved in 1970 to 1979 (%) - White
Year householder moved into unit - Moved in 1970 to 1979 (%) - Black or African American
Year householder moved into unit - Moved in 1970 to 1979 (%) - Asian
Year householder moved into unit - Moved in 1970 to 1979 (%) - Hispanic or Latino
Year householder moved into unit - Moved in 1970 to 1979 (%) - American Indian and Alaska Native
Year householder moved into unit - Moved in 1970 to 1979 (%) - Multirace
Year householder moved into unit - Moved in 1970 to 1979 (%) - Other Race
Year householder moved into unit - Moved in 1969 or earlier (%)
Year householder moved into unit - Moved in 1969 or earlier (%) - White
Year householder moved into unit - Moved in 1969 or earlier (%) - Black or African American
Year householder moved into unit - Moved in 1969 or earlier (%) - Asian
Year householder moved into unit - Moved in 1969 or earlier (%) - Hispanic or Latino
Year householder moved into unit - Moved in 1969 or earlier (%) - American Indian and Alaska Native
Year householder moved into unit - Moved in 1969 or earlier (%) - Multirace
Year householder moved into unit - Moved in 1969 or earlier (%) - Other Race
Housing units lacking complete plumbing facilities (%)
Housing units lacking complete kitchen facilities (%)
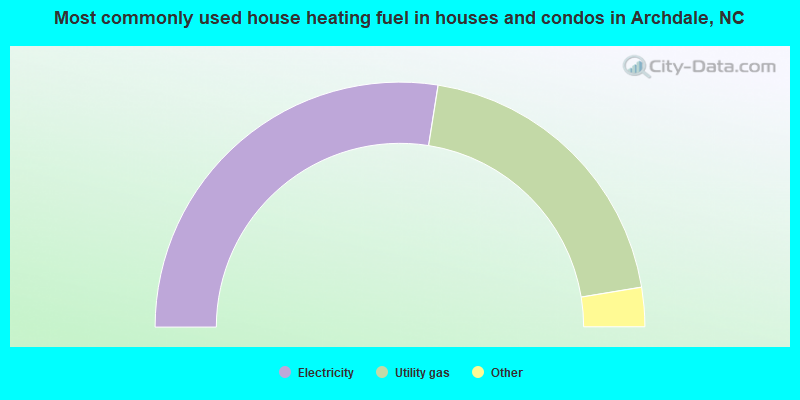
House heating fuel used in houses and condos - Utility gas (%)
House heating fuel used in houses and condos - Bottled, tank, or LP gas (%)
House heating fuel used in houses and condos - Electricity (%)
House heating fuel used in houses and condos - Fuel oil, kerosene, etc. (%)
House heating fuel used in houses and condos - Coal or coke (%)
House heating fuel used in houses and condos - Wood (%)
House heating fuel used in houses and condos - Solar energy (%)
House heating fuel used in houses and condos - Other fuel (%)
House heating fuel used in houses and condos - No fuel used (%)
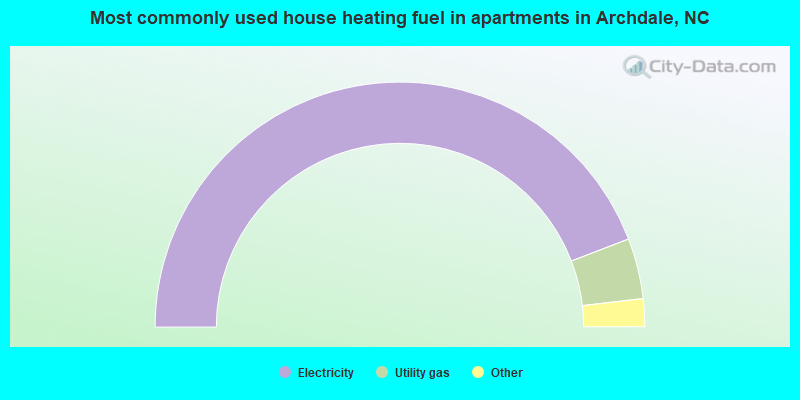
House heating fuel used in apartments - Utility gas (%)
House heating fuel used in apartments - Bottled, tank, or LP gas (%)
House heating fuel used in apartments - Electricity (%)
House heating fuel used in apartments - Fuel oil, kerosene, etc. (%)
House heating fuel used in apartments - Coal or coke (%)
House heating fuel used in apartments - Wood (%)
House heating fuel used in apartments - Solar energy (%)
House heating fuel used in apartments - Other fuel (%)
House heating fuel used in apartments - No fuel used (%)
Latest news about housing in Archdale, NC collected exclusively by city-data.com from local newspapers, TV, and radio stations
Median year house/condo built: 1989Median year apartment built: 1980Household type by relationship:
Households: 12,007
Male householders: 2,209 (485 living alone ), Female householders: 2,462 (810 living alone )2,398 spouses (2,369 opposite-sex spouses ), 338 unmarried partners , (320 opposite-sex unmarried partners ), 3,598 children (3,405 natural , 41 adopted , 151 stepchildren ), 294 grandchildren , 81 brothers or sisters , 166 parents , 0 foster children , 117 other relatives , 152 non-relatives In group quarters: 186
Size of family households: 1,400 2-persons , 804 3-persons , 565 4-persons , 81 5-persons , 233 6-persons , 77 7-or-more-persons .
Size of nonfamily households: 1,322 1-person , 269 2-persons , 6 3-persons .
1,576 married couples with children. single-parent households (212 men , 294 women ).
90.5% of residents of Archdale speak English at home. of residents speak Spanish at home (59% speak English very well , 20% speak English well , 11% speak English not well , 10% don't speak English at all ).of residents speak other Indo-European language at home (69% speak English very well , 9% speak English well , 13% speak English not well , 9% don't speak English at all ).of residents speak Asian or Pacific Island language at home (62% speak English very well , 16% speak English well , 22% speak English not well ).of residents speak other language at home (46% speak English well , 54% speak English not well ).
Foreign born population: 731 (6.1%)of them are naturalized citizens )
Median number of rooms in houses and condos:
Median number of rooms in apartments
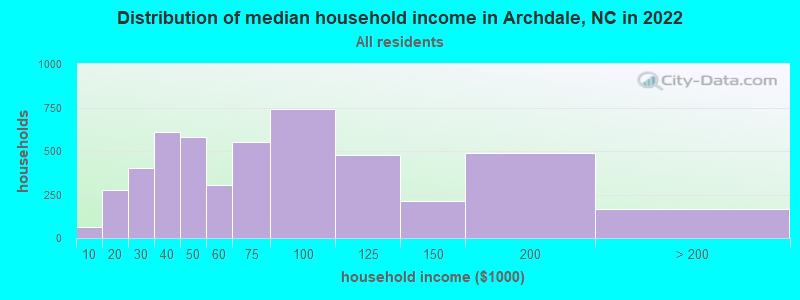
Archdale, NC household income distribution 64 Less than $10,000274 $10,000 to $19,999404 $20,000 to $29,999612 $30,000 to $39,999583 $40,000 to $49,999304 $50,000 to $59,999552 $60,000 to $74,999739 $75,000 to $99,999476 $100,000 to $124,999211 $125,000 to $149,999488 $150,000 to $199,999166 $200,000 or more
Home value of owner - occupied houses in 2022 in Archdale, NC 7 $10,000 to $14,9997 $15,000 to $19,9993 $25,000 to $29,9998 $30,000 to $34,99960 $40,000 to $49,99925 $50,000 to $59,9999 $60,000 to $69,999221 $70,000 to $79,9992 $80,000 to $89,99996 $90,000 to $99,999359 $100,000 to $124,999368 $125,000 to $149,999689 $150,000 to $174,999356 $175,000 to $199,999730 $200,000 to $249,999658 $250,000 to $299,999408 $300,000 to $399,99921 $400,000 to $499,99925 $1,000,000 to $1,499,99926 $2,000,000 or moreRent paid by renters in 2022 in Archdale, NC 14 Less than $10034 $350 to $39929 $400 to $44917 $450 to $49956 $500 to $54978 $550 to $599100 $600 to $64947 $650 to $69985 $700 to $74918 $750 to $799134 $800 to $89955 $900 to $99959 $1,000 to $1,2498 $1,250 to $1,49936 $1,500 to $1,99935 $2,000 to $2,49931 No cash rent
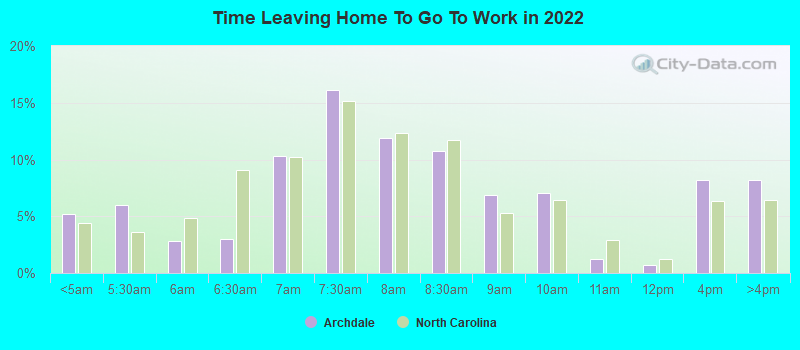
Percentage of workers working in this county: 29.4%Number of people working at home: 502 (8.1% of all workers )
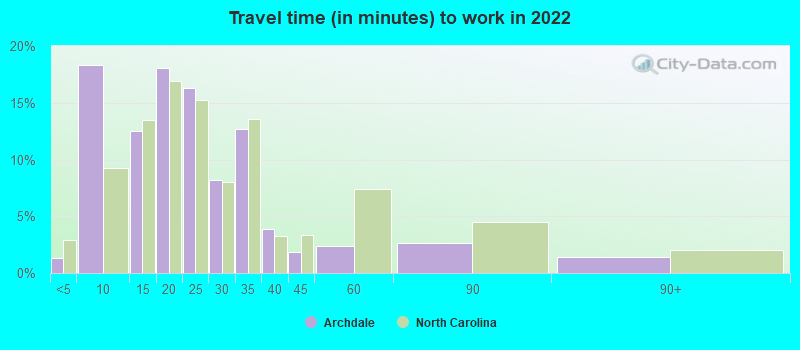
Travel time to work (commute)
Less than 5 minutes: 1745 to 9 minutes: 48310 to 14 minutes: 69315 to 19 minutes: 88120 to 24 minutes: 1,48725 to 29 minutes: 49330 to 34 minutes: 87635 to 39 minutes: 11240 to 44 minutes: 4145 to 59 minutes: 25660 to 89 minutes: 10990 or more minutes: 126
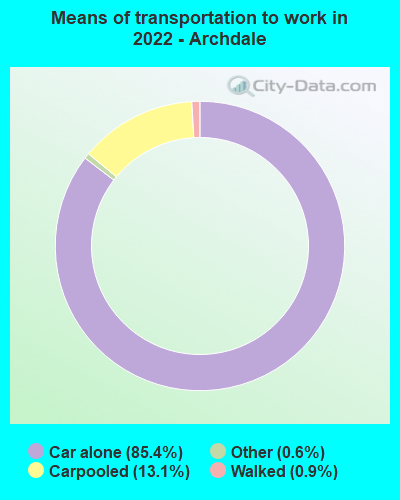
Means of transportation to work:
Drove a car alone: 3,513 (74.5%)Carpooled: 562 (11.9%)Taxi: 27 (0.6%)Walked: 38 (0.8%)Worked at home: 502 (10.6%)
Unemployment by race in 2022
Unemployment rate for White non-Hispanic residents 1.0% Males0.3% FemalesUnemployment rate for Asian residents 9.6% FemalesUnemployment rate for two or more race residents 14.1% Males
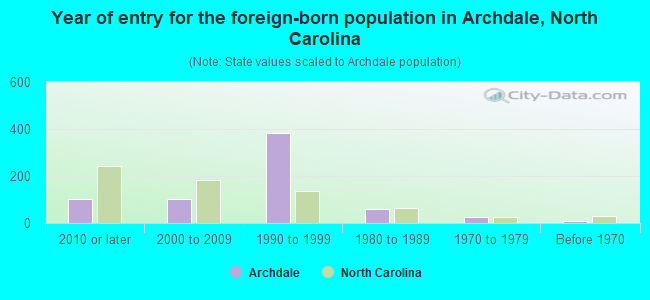
Year of entry for the foreign-born population in Archdale, North Carolina
103 2010 or later 102 2000 to 2009 383 1990 to 1999 58 1980 to 1989 24 1970 to 1979 10 Before 1970
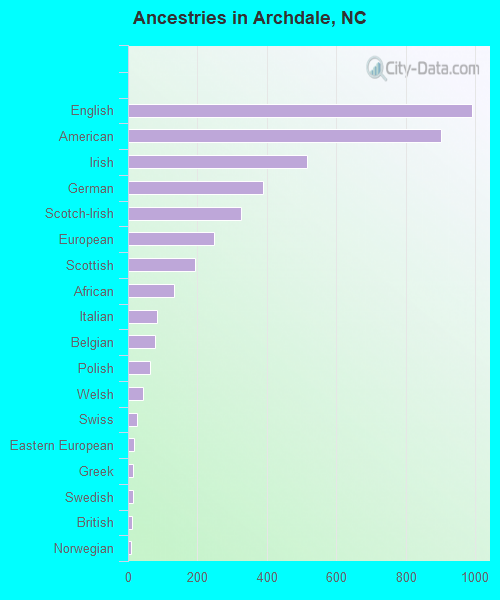
First ancestries reported:
English: 991 (13.5%)
American: 902 (12.3%)
Irish: 515 (7.0%)
German: 390 (5.3%)
Scotch-Irish: 325 (4.4%)
European: 249 (3.4%)
Scottish: 193 (2.6%)
African: 133 (1.8%)
Italian: 83 (1.1%)
Belgian: 77 (1.0%)
Polish: 64 (0.9%)
Welsh: 44 (0.6%)
Swiss: 25 (0.3%)
Eastern European: 17 (0.2%)
Greek: 13 (0.2%)
Swedish: 13 (0.2%)
British: 12 (0.2%)
Norwegian: 10 (0.1%)
French: 8 (0.1%) Most common places of birth for foreign-born residents (%): Vietnam Archdale:
41.3% (326)North Carolina:
2.9% (24,965)
Mexico Archdale:
21.1% (167)North Carolina:
24.7% (214,776)
Pakistan Archdale:
9.9% (78)North Carolina:
0.7% (6,226)
Algeria Archdale:
7.6% (60)North Carolina:
0.1% (694)
Poland Archdale:
4.8% (38)North Carolina:
0.4% (3,607)
Germany Archdale:
3.3% (26)North Carolina:
1.8% (15,534)
Honduras Archdale:
3.2% (25)North Carolina:
4.7% (40,707)
Belgium Archdale:
2.8% (22)North Carolina:
0.1% (904)
Italy Archdale:
1.9% (15)North Carolina:
0.5% (4,315)
Thailand Archdale:
1.5% (12)North Carolina:
0.7% (6,161)
Place of birth for U.S.-born residents:
This state: 7,818Other state: 3,444Northeast: 696Midwest: 658South: 1,741West: 262 91.3% of Archdale residents lived in the same house 1 years ago.
Out of people who lived in different houses, 27.1% lived in this county.
Out of people who lived in different counties, 84.4% lived in North Carolina.
Archdale:
91.3%State average:
87.3%
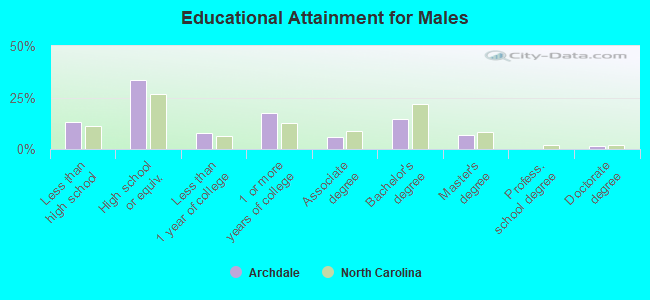
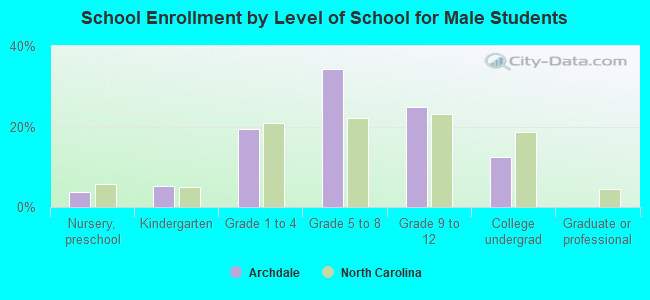
Education attainment for males 25 years and older:
No schooling: 108Nursery to 4th grade: 05th and 6th grade: 07th and 8th grade: 799th grade: 11710th grade: 3611th grade: 7612th grade, no diploma: 79High school graduate (or equivalency): 1,283Less than 1 year of college: 289Some college more than 1 year, no degree: 667Associate degree: 222Bachelor's degree: 551Master's degree: 251Professional school degree: 0Doctorate degree: 60
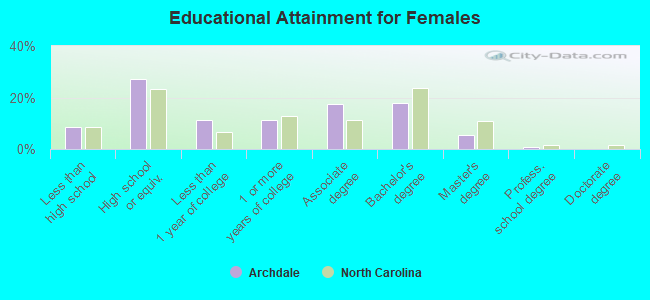
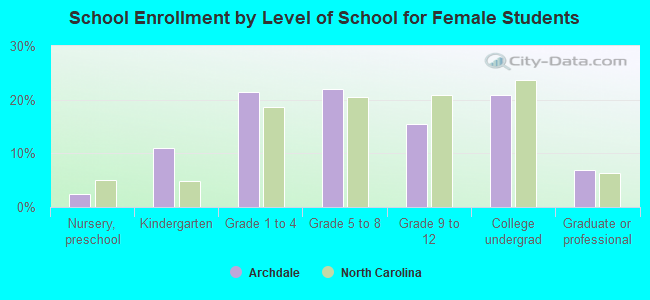
Education attainment for females 25 years and older:
No schooling: 72Nursery to 4th grade: 125th and 6th grade: 147th and 8th grade: 979th grade: 4810th grade: 6811th grade: 3012th grade, no diploma: 73High school graduate (or equivalency): 1,302Less than 1 year of college: 537Some college more than 1 year, no degree: 543Associate degree: 840Bachelor's degree: 852Master's degree: 253Professional school degree: 38Doctorate degree: 0
Housing units in structures:
One, detached: 3,655One, attached: 501Two: 1353 or 4: 1665 to 9: 22110 to 19: 24450 or more: 21Mobile homes: 4Housing units lacking complete kitchen facilities in 2022: 1.5%House/condo owner moved in on average 10 years ago
Renter moved in on average 1 years ago
Private vs. public school enrollment:
Students in private schools in grades 1 to 8 (elementary and middle school): 412 Here:
35.0%North Carolina:
13.8%
Students in private schools in grades 9 to 12 (high school): 70 Here:
13.9%North Carolina:
11.9%
Students in private undergraduate colleges: 35 Here:
9.0%North Carolina:
19.3%