Housing density: 502 houses/condos per square mile
Median price asked for vacant for-sale houses and condos in 2022 in this county: $294,896.
Median contract rent in 2022: $1,080 (lower quartile is $734, upper quartile is $1,371)
Median rent asked for vacant for-rent units in 2022: $1,121
Median gross rent in Agawam, MA in 2022: $1,231
Housing units in Agawam with a mortgage: 4,964 (399 second mortgage, 871 home equity loan, 0 both second mortgage and home equity loan) Houses without a mortgage: 2,269
In family households: 370,558 (69,901 male householders, 46,060 female householders)
75,335 spouses, 139,777 children (131,178 natural, 3,169 adopted, 5,430 stepchildren), 9,761 grandchildren, 4,611 brothers or sisters, 4,384 parents, foster children, 5,451 other relatives, 12,672 non-relatives
In nonfamily households: 78,141 (28,658 male householders (22,507 living alone)), 35,308 female householders (30,105 living alone)), 14,175 nonrelatives
In group quarters: 14,791 (5,845 institutionalized population)
67,791 married couples with children.
39,215 single-parent households (5,649 men, 33,566 women).
91.4% of residents of Agawam speak English at home.
1.3% of residents speak Spanish at home (75% speak English very well, 18% speak English well, 7% speak English not well).
6.1% of residents speak other Indo-European language at home (73% speak English very well, 17% speak English well, 7% speak English not well, 2% don't speak English at all).
0.7% of residents speak Asian or Pacific Island language at home (53% speak English very well, 27% speak English well, 14% speak English not well, 6% don't speak English at all).
0.5% of residents speak other language at home (73% speak English very well, 7% speak English well, 20% speak English not well).
Foreign born population: 1,992 (7.0%)
(70.0% of them are naturalized citizens)
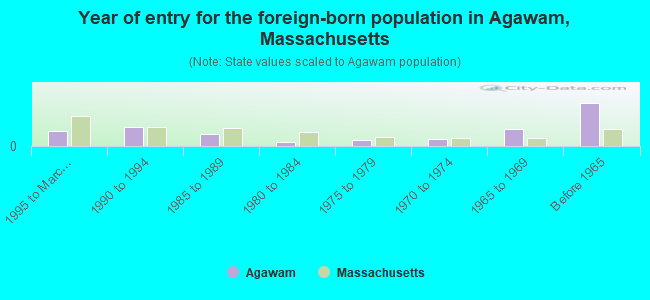
Year of entry for the foreign-born population in Agawam, Massachusetts
1881995 to March 2000
2351990 to 1994
1471985 to 1989
431980 to 1984
751975 to 1979
801970 to 1974
2131965 to 1969
521Before 1965
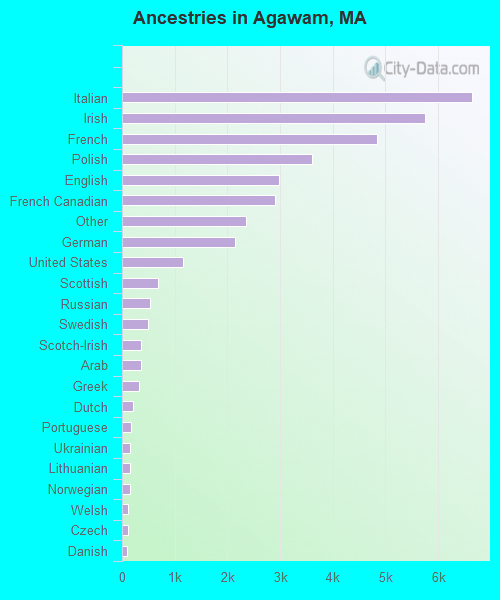
First ancestries reported:
Italian: 6,633 (18.2%)
Irish: 5,752 (15.8%)
French: 4,839 (13.3%)
Polish: 3,614 (9.9%)
English: 2,984 (8.2%)
French Canadian: 2,909 (8.0%)
Other: 2,346 (6.4%)
German: 2,143 (5.9%)
United States: 1,161 (3.2%)
Scottish: 680 (1.9%)
Russian: 523 (1.4%)
Swedish: 495 (1.4%)
Scotch-Irish: 369 (1.0%)
Arab: 356 (1.0%)
Greek: 323 (0.9%)
Dutch: 200 (0.5%)
Portuguese: 180 (0.5%)
Ukrainian: 152 (0.4%)
Lithuanian: 149 (0.4%)
Norwegian: 147 (0.4%)
Welsh: 121 (0.3%)
Czech: 106 (0.3%)
Danish: 88 (0.2%)
West Indian: 60 (0.2%)
Swiss: 51 (0.1%)
Slovak: 48 (0.1%)
Hungarian: 41 (0.1%)
Subsaharan African: 23 (0.06%)
Most common places of birth for foreign-born residents (%):
Italy
Agawam:
16.0% (240)
Massachusetts:
3.7% (28,319)
Canada
Agawam:
14.6% (219)
Massachusetts:
5.2% (40,247)
United Kingdom
Agawam:
9.7% (145)
Massachusetts:
3.3% (25,403)
Russia
Agawam:
9.5% (143)
Massachusetts:
2.3% (17,449)
Vietnam
Agawam:
5.0% (75)
Massachusetts:
3.9% (30,457)
Germany
Agawam:
4.6% (69)
Massachusetts:
1.9% (14,883)
Ukraine
Agawam:
4.5% (68)
Massachusetts:
1.1% (8,754)
India
Agawam:
4.5% (67)
Massachusetts:
3.6% (28,086)
China, excluding Hong Kong and Taiwan
Agawam:
3.4% (51)
Massachusetts:
5.1% (39,255)
Poland
Agawam:
3.3% (50)
Massachusetts:
1.8% (13,543)
Other Eastern Europe
Agawam:
2.1% (31)
Massachusetts:
1.6% (12,350)
Ireland
Agawam:
1.9% (28)
Massachusetts:
2.3% (17,987)
Lebanon
Agawam:
1.9% (28)
Massachusetts:
0.9% (6,691)
Portugal
Agawam:
1.7% (26)
Massachusetts:
8.6% (66,627)
Jamaica
Agawam:
1.7% (26)
Massachusetts:
1.7% (12,808)
Japan
Agawam:
1.7% (26)
Massachusetts:
1.1% (8,682)
Costa Rica
Agawam:
1.5% (23)
Massachusetts:
0.2% (1,700)
Place of birth for U.S.-born residents:
This state: 21,446
Other state: 4,991
Northeast: 3,263
Midwest: 572
South: 766
West: 390
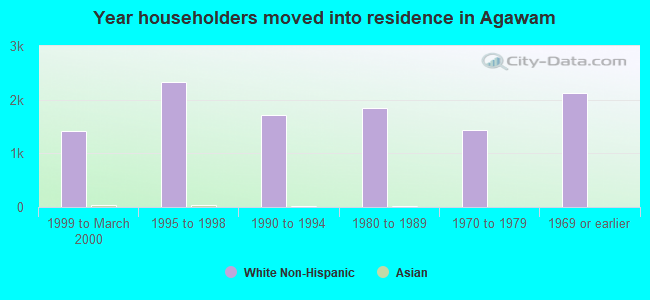
66% of Agawam residents lived in the same house 5 years ago. Out of people who lived in different houses, 83% lived in this county. Out of people who lived in different counties, 39% lived in Massachusetts.
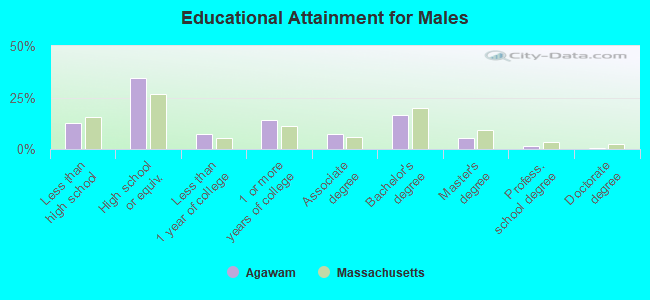
Education attainment for males 25 years and older:
No schooling: 76
Nursery to 4th grade: 0
5th and 6th grade: 12
7th and 8th grade: 231
9th grade: 218
10th grade: 178
11th grade: 227
12th grade, no diploma: 227
High school graduate (or equivalency): 3,203
Less than 1 year of college: 699
Some college more than 1 year, no degree: 1,317
Associate degree: 694
Bachelor's degree: 1,536
Master's degree: 487
Professional school degree: 141
Doctorate degree: 50
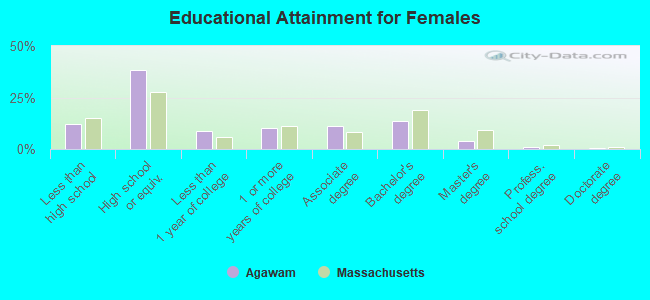
Education attainment for females 25 years and older:
No schooling: 44
Nursery to 4th grade: 0
5th and 6th grade: 154
7th and 8th grade: 229
9th grade: 183
10th grade: 283
11th grade: 238
12th grade, no diploma: 213
High school graduate (or equivalency): 4,166
Less than 1 year of college: 949
Some college more than 1 year, no degree: 1,102
Associate degree: 1,192
Bachelor's degree: 1,502
Master's degree: 441
Professional school degree: 117
Doctorate degree: 49
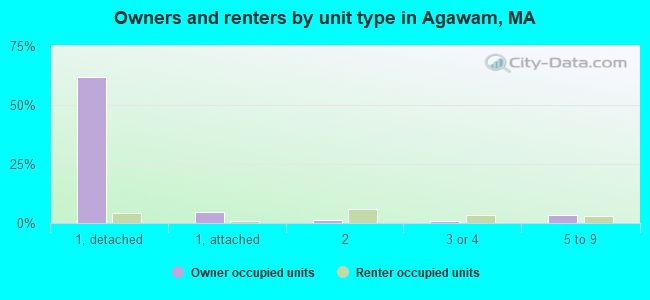
Housing units in structures:
One, detached: 7,573
One, attached: 643
Two: 848
3 or 4: 488
5 to 9: 700
10 to 19: 469
20 to 49: 543
50 or more: 360
Mobile homes: 35
Median worth of mobile homes: $55,154
Housing units lacking complete kitchen facilities: 1.0%