Woodland: Fire Incidents, California (CA)
Where are fire incidents reported in Woodland, CA
Something went wrong! Please refresh the page.
| Fire incidents reported | |
|---|---|
| Sreet name | Count |
| MAIN ST | 574 |
| EAST ST | 212 |
| COURT ST | 176 |
| KENTUCKY AVE | 172 |
| BEAMER ST | 154 |
| PIONEER AVE | 144 |
| GIBSON RD | 138 |
| MATMOR RD | 126 |
| CALIFORNIA ST | 118 |
| COTTONWOOD ST | 114 |
| WEST ST | 94 |
| COLLEGE ST | 90 |
| I5 | 88 |
| LINCOLN AVE | 82 |
| CR102 | 74 |
| 4TH ST | 72 |
| CROSS ST | 72 |
| I 5 | 70 |
| GUM AVE | 60 |
| ASHLEY AVE | 58 |
| ELLIOT ST | 58 |
| WOODLAND AVE | 56 |
| 5TH ST | 54 |
| 6TH ST | 54 |
| OAK AVE | 52 |
| SB I5 | 52 |
| NORTH ST | 48 |
| SR113 | 48 |
| 3RD ST | 44 |
| CLOVER ST | 42 |
2005 - 2018 National Fire Incident Reporting System (NFIRS) incidents
- Incident types reported to NFIRS in Woodland, CA
- 16,75054.1%Rescue & EMS
- 4,03813.0%Service Call
- 3,85512.4%Good Intent Call
- 3,11710.1%Fire
- 1,9826.4%Hazardous Condition
- 1,2153.9%False Alarm
- Fire incident types reported to NFIRS in Woodland, CA
- 1,72455.3%Outside Fires
- 85627.5%Structure Fires
- 46014.8%Mobile Property/Vehicle Fires
- 772.5%Other
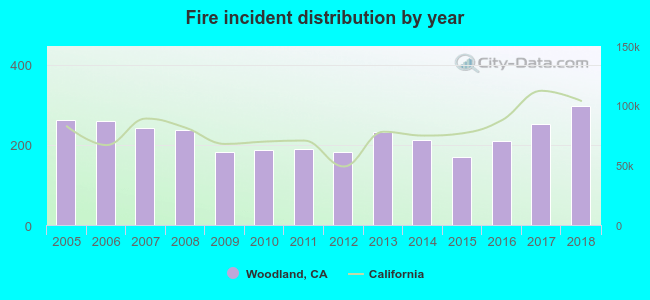 Based on the data from the years 2005 - 2018 the average number of fires per year is 223. The highest number of fires - 298 took place in 2018, and the least - 169 in 2015. The data has an increasing trend.
The average number of yearly fire incidents per 10k residents in Woodland, CA compared to nearest cities:
(Note: Based on data for the last 3 years, including only cities with population 5,000 and above)
| Woodland: | 44.1 |
| Davis: | 12.8 |
| West Sacramento: | 58.9 |
| Winters: | 58.1 |
| Dixon: | 3.7 |
| Elverta: | 94.1 |
| Rio Linda: | 39.7 |
| Sacramento: | 69.5 |
| North Highlands: | 46.8 |
 The median response time based on all reported fire incidents is 6 minutes. This is close to the California median value.
The median response time in Woodland, CA compared to nearest cities:
(Note: Based on data for all years, including only cities with at least 500 fire incidents)
| Woodland: | 6 minutes |
| Davis: | 6 minutes |
| West Sacramento: | 5 minutes |
| Dixon: | 8 minutes |
| Elverta: | 6 minutes |
| Rio Linda: | 5 minutes |
| Sacramento: | 5 minutes |
| North Highlands: | 5 minutes |
| Florin: | 5 minutes |
 According to the reports from the years 2005 - 2018 the average number of fire-related fatalities per year is 0. The highest number of reported deaths - 1 took place in 2005, and the lowest - 0 in 2006. The data has a decreasing trend.
The average number of fatalities per 1,000 fires is 1. This indicator was the highest - 5 in 2011, and the lowest 0 in 2006. The trend for deaths per 1,000 incidents is declining. Compared to the California value the number of deaths per 1,000 incidents is lower.
According to the reports from the years 2005 - 2018 the average number of fire-related fatalities per year is 0. The highest number of reported deaths - 1 took place in 2005, and the lowest - 0 in 2006. The data has a decreasing trend.
The average number of fatalities per 1,000 fires is 1. This indicator was the highest - 5 in 2011, and the lowest 0 in 2006. The trend for deaths per 1,000 incidents is declining. Compared to the California value the number of deaths per 1,000 incidents is lower.Deaths per 1,000 incidents in Woodland, CA compared to nearest cities:
(Note: Based on data for all years, including only cities with at least 2,500 fire incidents)
| Woodland: | 1.0 |
| Sacramento: | 0.6 |
| Florin: | 0.0 |
| Vacaville: | 0.7 |
| Mather: | 0.0 |
| Rancho Cordova: | 0.8 |
| Roseville: | 0.4 |
| Yuba City: | 0.5 |
 Based on the data from the years 2005 - 2018 the average number of fire-related casualties per year is 2. The highest number of casualties - 4 took place in 2006, and the lowest - 0 in 2011. The data has a constant trend.
The average number of casualties per 1,000 fire incidents is 9. This indicator was the highest - 22 in 2012, and the lowest 0 in 2011. The trend for casualties per 1,000 fire incidents is declining. Compared to the state value the number of injuries per 1,000 fire incidents is higher.
Based on the data from the years 2005 - 2018 the average number of fire-related casualties per year is 2. The highest number of casualties - 4 took place in 2006, and the lowest - 0 in 2011. The data has a constant trend.
The average number of casualties per 1,000 fire incidents is 9. This indicator was the highest - 22 in 2012, and the lowest 0 in 2011. The trend for casualties per 1,000 fire incidents is declining. Compared to the state value the number of injuries per 1,000 fire incidents is higher.Casualties per 1,000 incidents in Woodland, CA compared to nearest cities:
(Note: Based on data for all years, including only cities with at least 500 fire incidents)
| Woodland: | 8.3 |
| Davis: | 10.4 |
| West Sacramento: | 4.0 |
| Dixon: | 5.0 |
| Elverta: | 0.0 |
| Rio Linda: | 1.2 |
| Sacramento: | 2.3 |
| North Highlands: | 0.0 |
| Florin: | 3.6 |
 32.9% incidents where reported in the morning and 67.1% in the evening. The most fires (14.8%) took place on Sunday, and the least (13.3%) on Thursday.
 According to the 3,117 fire incidents from years 2005 - 2018 most fires (12.8%) took place during July, and the least (5.8%) in February.
 Out of all 30,985 cases reported during the years 2005 - 2018, the most belonged to the categories: Rescue & EMS (54.1%), Service Call (13.0%), and Good Intent Call (12.4%).
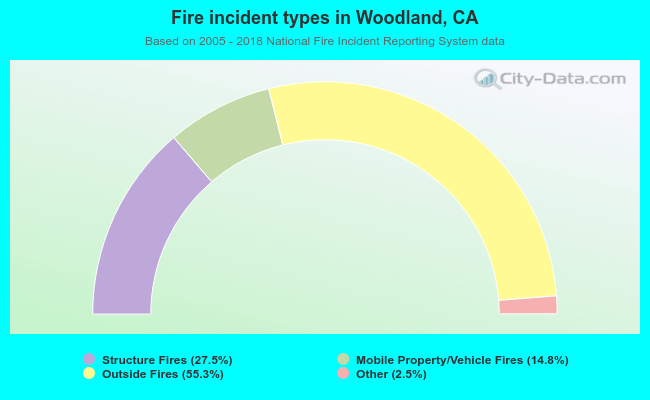 When looking into fire subcategories, the most reports belonged to: Outside Fires (55.3%), and Structure Fires (27.5%).