West Orange: Fire Incidents, New Jersey (NJ)
Where are fire incidents reported in West Orange, NJ
Something went wrong! Please refresh the page.
| Fire incidents reported | |
|---|---|
| Sreet name | Count |
| PROSPECT AV | 158 |
| PLEASANT VALLEY WY | 120 |
| NORTHFIELD AV | 116 |
| MAIN ST | 102 |
| EAGLE ROCK AV | 90 |
| I-280 | 86 |
| I280 | 76 |
| MOUNT PLEASANT AV | 76 |
| ESSEX GREEN PLAZA | 72 |
| VALLEY RD | 58 |
| OLD SHORT HILLS RD | 56 |
| VALLEY RD | 56 |
| ORANGE CITY OF | 48 |
| NORTHFIELD AV AVE | 42 |
| I-280 RT | 40 |
| GREGORY AV | 32 |
| WATCHUNG AV | 32 |
| MAIN ST ST | 28 |
| WEST ORANGE PLAZA | 28 |
| WOODLAND AV | 28 |
| CHERRY LA | 24 |
| OLD SHORT HILLS RD RD | 24 |
| PROSPECT AV AVE | 24 |
| WASHINGTON ST | 24 |
| EAGLE ROCK RESERVATION | 20 |
| I-280 HWY | 20 |
| MITCHELL ST | 20 |
| PLEASANT VALLEY WY WAY | 20 |
| EAGLE ROCK AV AVE | 18 |
| FREEMAN ST | 18 |
| Other | 226 |
2003 - 2018 National Fire Incident Reporting System (NFIRS) incidents
- Incident types reported to NFIRS in West Orange, NJ
- 18,98452.6%Rescue & EMS
- 6,04416.7%Hazardous Condition
- 3,81210.6%Service Call
- 3,77010.4%False Alarm
- 1,7824.9%Fire
- 1,5524.3%Good Intent Call
- 880.2%Severe Weather
- 520.1%Overpressure Rupture
- Fire incident types reported to NFIRS in West Orange, NJ
- 94052.7%Structure Fires
- 42323.7%Outside Fires
- 37220.9%Mobile Property/Vehicle Fires
- 472.6%Other
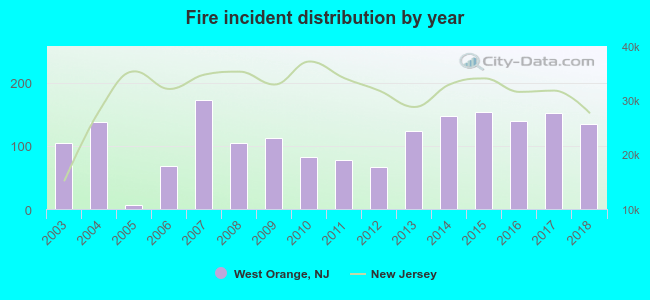 According to the data from the years 2003 - 2018 the average number of fire incidents per year is 111. The highest number of fires - 172 took place in 2007, and the least - 6 in 2005. The data has an increasing trend.
The average number of yearly fire incidents per 10k residents in West Orange, NJ compared to nearest cities:
(Note: Based on data for the last 3 years, including only cities with population 5,000 and above)
| West Orange: | 32.6 |
| Orange: | 24.7 |
| East Orange: | 48.4 |
| South Orange: | 24.3 |
| Glen Ridge: | 15.6 |
| Verona: | 1.9 |
| Montclair: | 14.4 |
| Roseland: | 34.3 |
| Livingston: | 15.4 |
 The median response time based on all reported fire incidents is 5 minutes. This is about the same as the New Jersey median value.
The median response time in West Orange, NJ compared to nearest cities:
(Note: Based on data for all years, including only cities with at least 500 fire incidents)
| West Orange: | 5 minutes |
| Orange: | 3 minutes |
| East Orange: | 4 minutes |
| South Orange: | 3 minutes |
| Montclair: | 3 minutes |
| Livingston: | 0 minutes |
| Bloomfield: | 2 minutes |
| Maplewood: | 3 minutes |
| West Caldwell: | 3 minutes |
 According to the data from the years 2003 - 2018 the average number of fire-related casualties per year is 1. The highest number of reported casualties - 5 took place in 2013, and the lowest - 0 in 2004. The data has a declining trend.
The average number of casualties per 1,000 fire incidents is 10. This indicator was the highest - 41 in 2013, and the lowest 0 in 2004. The trend for injuries per 1,000 incidents is declining. Compared to the state value the number of casualties per 1,000 fires is similar.
According to the data from the years 2003 - 2018 the average number of fire-related casualties per year is 1. The highest number of reported casualties - 5 took place in 2013, and the lowest - 0 in 2004. The data has a declining trend.
The average number of casualties per 1,000 fire incidents is 10. This indicator was the highest - 41 in 2013, and the lowest 0 in 2004. The trend for injuries per 1,000 incidents is declining. Compared to the state value the number of casualties per 1,000 fires is similar.Casualties per 1,000 incidents in West Orange, NJ compared to nearest cities:
(Note: Based on data for all years, including only cities with at least 500 fire incidents)
| West Orange: | 10.1 |
| Orange: | 6.0 |
| East Orange: | 10.9 |
| South Orange: | 8.9 |
| Montclair: | 14.0 |
| Livingston: | 5.2 |
| Bloomfield: | 9.9 |
| Maplewood: | 18.6 |
| West Caldwell: | 7.6 |
 30.5% incidents where reported in the morning and 69.5% in the evening. The most fires (15.4%) took place on Saturday, and the least (13.6%) on Tuesday.
 According to the 1,782 fire incident reports from years 2003 - 2018 most fires (12.6%) took place during April, and the least (6.2%) in December.
 Out of all 36,098 cases reported during the years 2003 - 2018, the most belonged to the categories: Rescue & EMS (52.6%), Hazardous Condition (16.7%), and Service Call (10.6%).
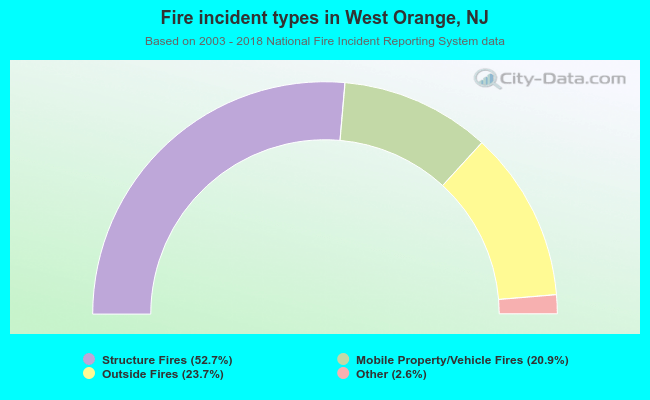 When looking into fire subcategories, the most incidents belonged to: Structure Fires (52.7%), and Outside Fires (23.7%).