Waupaca: Fire Incidents, Wisconsin (WI)
Where are fire incidents reported in Waupaca, WI
Something went wrong! Please refresh the page.
|
| |||||||||||||||||||||||||||||||||||||||||||||||||||||||||||||||||||||||||||||||||||||||||||||||||||||||||||||
| Other | 25 | |||||||||||||||||||||||||||||||||||||||||||||||||||||||||||||||||||||||||||||||||||||||||||||||||||||||||||||
2003 - 2018 National Fire Incident Reporting System (NFIRS) incidents
- Incident types reported to NFIRS in Waupaca, WI
- 39929.3%Hazardous Condition
- 28120.6%Fire
- 27019.8%Good Intent Call
- 25318.5%Rescue & EMS
- 1168.5%False Alarm
- 352.6%Service Call
- 60.4%Special Incident
- 30.2%Severe Weather
- Fire incident types reported to NFIRS in Waupaca, WI
- 15555.2%Structure Fires
- 7526.7%Outside Fires
- 3813.5%Mobile Property/Vehicle Fires
- 134.6%Other
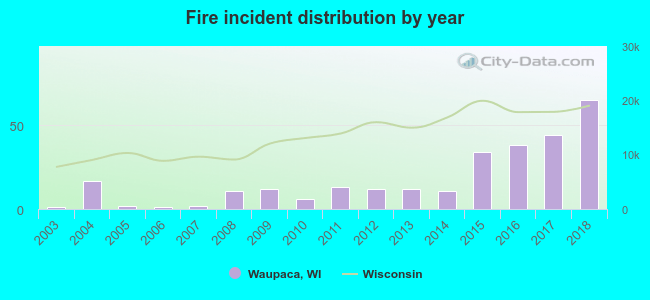 Based on the data from the years 2003 - 2018 the average number of fire incidents per year is 18. The highest number of reported fires - 65 took place in 2018, and the least - 1 in 2003. The data has a rising trend.
The average number of yearly fire incidents per 10k residents in Waupaca, WI compared to nearest cities:
(Note: Based on data for the last 3 years, including only cities with population 5,000 and above)
| Waupaca: | 81.4 |
| New London: | 51.3 |
| Plover: | 42.7 |
| Stevens Point: | 34.8 |
| Greenville: | 20.4 |
| Berlin: | 50.3 |

 33.1% incidents where reported in the morning and 66.9% in the evening. The most fires (18.5%) took place on Saturday, and the least (10.3%) on Thursday.
 Based on the 281 fire incidents from years 2003 - 2018 most fires (16.7%) took place during April, and the least (2.8%) in June.
 Out of all 1,364 cases reported during the years 2003 - 2018, the most belonged to the categories: Hazardous Condition (29.3%), Fire (20.6%), and Good Intent Call (19.8%).
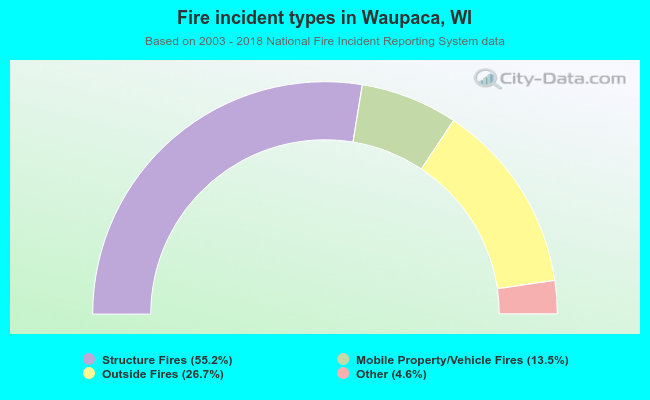 When looking into fire subcategories, the most incidents belonged to: Structure Fires (55.2%), and Outside Fires (26.7%).