Ville Platte: Fire Incidents, Louisiana (LA)
Where are fire incidents reported in Ville Platte, LA
Something went wrong! Please refresh the page.
|
| |||||||||||||||||||||||||||||||||||||||||||||||||||||||||||||||||||||||||||||||||||||||||||||||||||||||||||||
2002 - 2018 National Fire Incident Reporting System (NFIRS) incidents
- Incident types reported to NFIRS in Ville Platte, LA
- 1,00148.4%Fire
- 42120.3%Rescue & EMS
- 29014.0%Hazardous Condition
- 1808.7%False Alarm
- 1205.8%Good Intent Call
- 532.6%Service Call
- 30.1%Special Incident
- Fire incident types reported to NFIRS in Ville Platte, LA
- 41141.1%Structure Fires
- 37937.9%Outside Fires
- 16416.4%Mobile Property/Vehicle Fires
- 474.7%Other
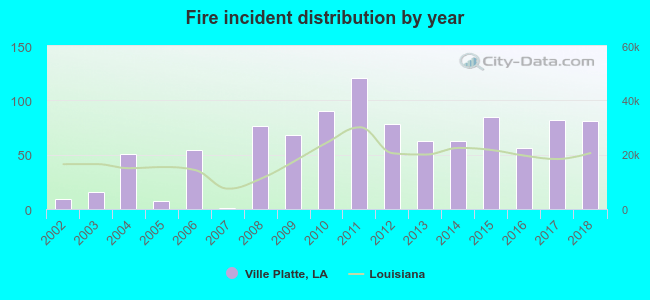 According to the data from the years 2002 - 2018 the average number of fires per year is 59. The highest number of fires - 121 took place in 2011, and the least - 1 in 2007. The data has a growing trend.
The average number of yearly fire incidents per 10k residents in Ville Platte, LA compared to nearest cities:
(Note: Based on data for the last 3 years, including only cities with population 5,000 and above)
| Ville Platte: | 100.2 |
| Eunice: | 91.6 |
| Opelousas: | 158.9 |
| Oakdale: | 115.7 |
| Carencro: | 113.6 |
| Rayne: | 54.3 |
| Marksville: | 79.2 |
| Scott: | 94.7 |
| Crowley: | 64.4 |
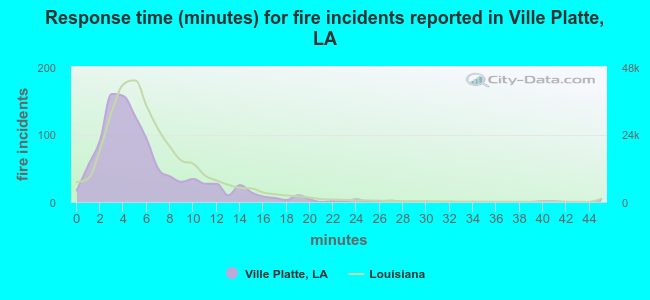 The median response time based on all reported fire incidents is 5 minutes. This is lower than the Louisiana median value.
The median response time in Ville Platte, LA compared to nearest cities:
(Note: Based on data for all years, including only cities with at least 500 fire incidents)
| Ville Platte: | 5 minutes |
| Eunice: | 4 minutes |
| Opelousas: | 5 minutes |
| Church Point: | 7 minutes |
| Oakdale: | 5 minutes |
| Glenmora: | 9 minutes |
| Arnaudville: | 11 minutes |
| Carencro: | 8 minutes |
| Rayne: | 6 minutes |
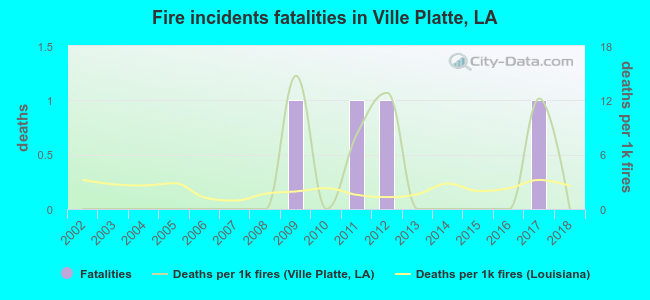 According to the data from the years 2002 - 2018 the average number of fire-related fatalities per year is 0. The highest number of deaths - 1 took place in 2009, and the lowest - 0 in 2002. The data has a constant trend.
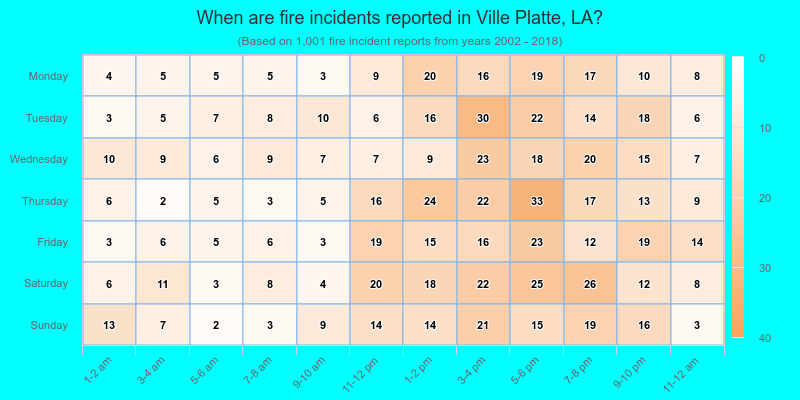
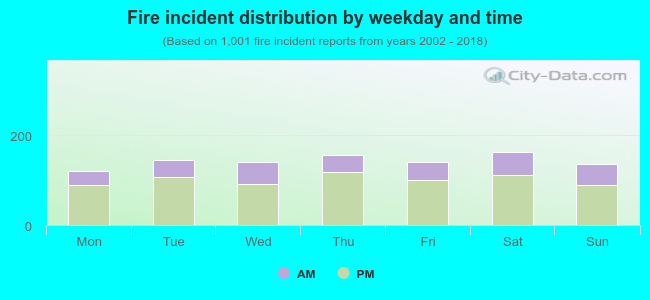 29.7% incidents where reported in the morning and 70.3% in the evening. The most fires (16.3%) took place on Saturday, and the least (12.1%) on Monday.
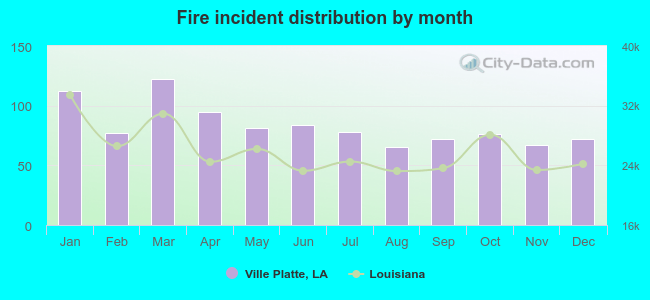 According to the 1,001 fires from years 2002 - 2018 most fires (12.2%) took place during March, and the least (6.5%) in August.
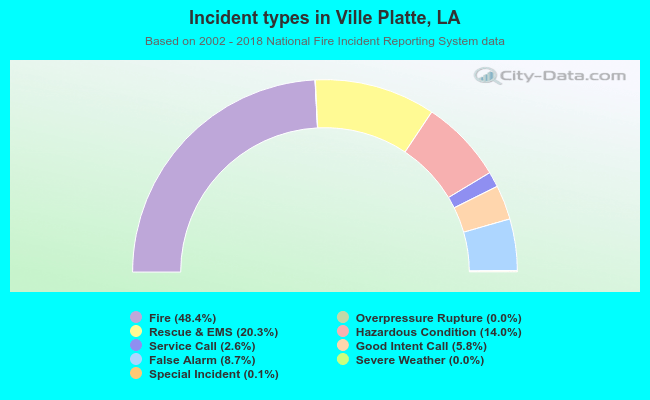 Out of all 2,070 cases reported during the years 2002 - 2018, the most belonged to the categories: Fire (48.4%), Rescue & EMS (20.3%), and Hazardous Condition (14.0%).
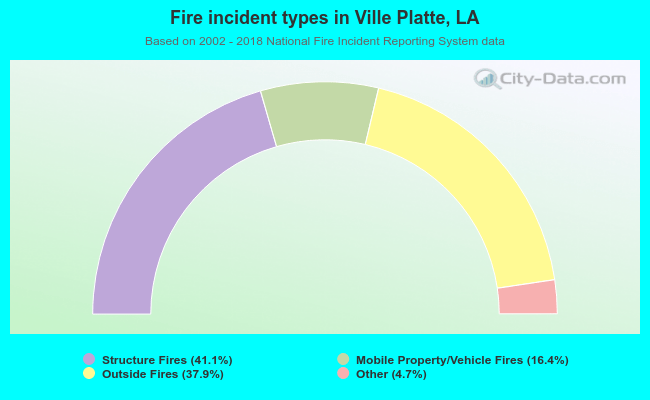 When looking into fire subcategories, the most incidents belonged to: Structure Fires (41.1%), and Outside Fires (37.9%).