Uxbridge: Fire Incidents, Massachusetts (MA)
Where are fire incidents reported in Uxbridge, MA
Something went wrong! Please refresh the page.
| Fire incidents reported | |
|---|---|
| Sreet name | Count |
| CENTENNIAL CT | 120 |
| QUAKER HWY | 114 |
| DOUGLAS ST | 94 |
| RTE 146 | 90 |
| N MAIN ST | 82 |
| E HARTFORD AVE | 70 |
| CALUMET CT | 64 |
| HAZEL ST | 58 |
| ALDRICH ST | 56 |
| W HARTFORD AVE | 50 |
| DEPOT ST | 44 |
| MILLVILLE RD | 44 |
| MENDON ST | 40 |
| CHOCOLOG RD | 38 |
| S MAIN ST | 38 |
| WEST ST | 38 |
| RIVER RD | 36 |
| W RIVER RD | 34 |
| ALBEE RD | 32 |
| HECLA ST | 32 |
| POND ST | 30 |
| HENRY ST | 28 |
| MAIN ST | 28 |
| BLACKSTONE ST | 26 |
| RIVULET ST | 26 |
| CARNEY ST | 24 |
| CHESTNUT ST | 24 |
| LINWOOD ST | 24 |
| OAK ST | 24 |
| GLENDALE ST | 22 |
2002 - 2018 National Fire Incident Reporting System (NFIRS) incidents
- Incident types reported to NFIRS in Uxbridge, MA
- 3,81645.0%Rescue & EMS
- 1,26114.9%Fire
- 1,13613.4%Hazardous Condition
- 91910.8%False Alarm
- 7148.4%Service Call
- 6087.2%Good Intent Call
- 120.1%Special Incident
- 100.1%Overpressure Rupture
- Fire incident types reported to NFIRS in Uxbridge, MA
- 66853.0%Structure Fires
- 35928.5%Outside Fires
- 16012.7%Mobile Property/Vehicle Fires
- 745.9%Other
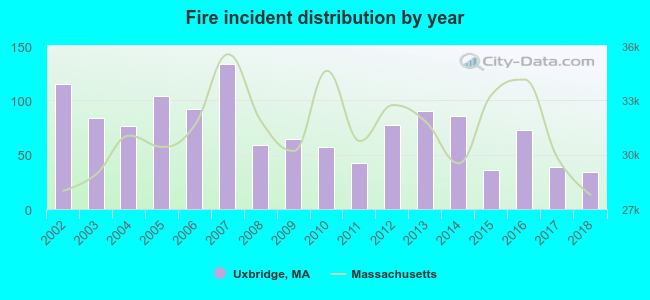 Based on the data from the years 2002 - 2018 the average number of fire incidents per year is 74. The highest number of reported fire incidents - 133 took place in 2007, and the least - 34 in 2018. The data has a declining trend.
The average number of yearly fire incidents per 10k residents in Uxbridge, MA compared to nearest cities:
(Note: Based on data for the last 3 years, including only cities with population 5,000 and above)
| Uxbridge: | 36.2 |
| Whitinsville: | 3.0 |
| Northbridge: | 32.5 |
| Mendon: | 15.4 |
| Douglas: | 33.4 |
| Blackstone: | 17.7 |
| Sutton: | 44.3 |
| Upton: | 33.6 |
| Milford: | 41.4 |
 The median response time based on all reported fire incidents is 7 minutes. This is higher compared to the Massachusetts median value.
The median response time in Uxbridge, MA compared to nearest cities:
(Note: Based on data for all years, including only cities with at least 500 fire incidents)
| Uxbridge: | 7 minutes |
| Northbridge: | 7 minutes |
| Douglas: | 8 minutes |
| Blackstone: | 5 minutes |
| Sutton: | 8 minutes |
| Upton: | 5 minutes |
| Milford: | 5 minutes |
| Bellingham: | 7 minutes |
| Millbury: | 6 minutes |
 Based on the data from the years 2002 - 2018 the average number of fire-related casualties per year is 2. The highest number of casualties - 6 took place in 2016, and the lowest - 0 in 2008. The data has a constant trend.
The average number of casualties per 1,000 fire incidents is 25. This indicator was the highest - 82 in 2016, and the lowest 0 in 2008. The trend for injuries per 1,000 fire incidents is growing. Compared to the state value the number of casualties per 1,000 fires is much higher.
Based on the data from the years 2002 - 2018 the average number of fire-related casualties per year is 2. The highest number of casualties - 6 took place in 2016, and the lowest - 0 in 2008. The data has a constant trend.
The average number of casualties per 1,000 fire incidents is 25. This indicator was the highest - 82 in 2016, and the lowest 0 in 2008. The trend for injuries per 1,000 fire incidents is growing. Compared to the state value the number of casualties per 1,000 fires is much higher.Casualties per 1,000 incidents in Uxbridge, MA compared to nearest cities:
(Note: Based on data for all years, including only cities with at least 500 fire incidents)
| Uxbridge: | 24.6 |
| Northbridge: | 20.6 |
| Douglas: | 7.6 |
| Blackstone: | 15.5 |
| Sutton: | 0.0 |
| Upton: | 1.6 |
| Milford: | 25.0 |
| Bellingham: | 12.0 |
| Millbury: | 23.2 |
 31.2% incidents where reported in the morning and 68.8% in the evening. The most fires (18.0%) took place on Saturday, and the least (12.3%) on Sunday.
 Based on the 1,261 fires from years 2002 - 2018 most fires (14.0%) took place during April, and the least (4.8%) in October.
 Out of all 8,483 cases reported during the years 2002 - 2018, the most belonged to the categories: Rescue & EMS (45.0%), Fire (14.9%), and Hazardous Condition (13.4%).
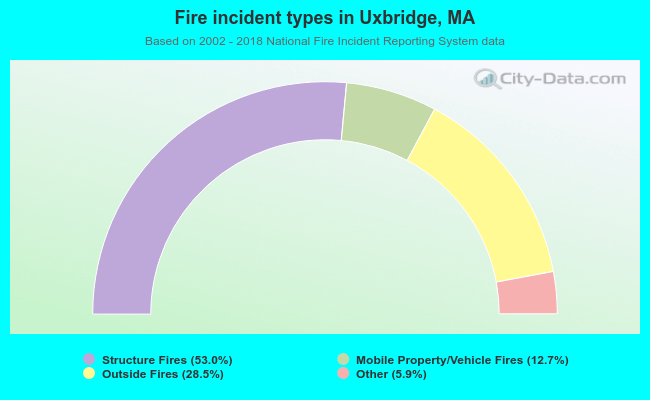 When looking into fire subcategories, the most reports belonged to: Structure Fires (53.0%), and Outside Fires (28.5%).