Umatilla: Fire Incidents, Oregon (OR)
Where are fire incidents reported in Umatilla, OR
Something went wrong! Please refresh the page.
|
| |||||||||||||||||||||||||||||||||||||||||||||||||||||||||||||||||||||||||||||||||||||||||||||||||||||||||||||
2002 - 2018 National Fire Incident Reporting System (NFIRS) incidents
- Incident types reported to NFIRS in Umatilla, OR
- 37953.1%Rescue & EMS
- 20328.4%Fire
- 689.5%Good Intent Call
- 324.5%Service Call
- 162.2%Hazardous Condition
- 152.1%False Alarm
- 10.1%Overpressure Rupture
- Fire incident types reported to NFIRS in Umatilla, OR
- 12963.5%Outside Fires
- 4723.2%Structure Fires
- 2311.3%Mobile Property/Vehicle Fires
- 42.0%Other
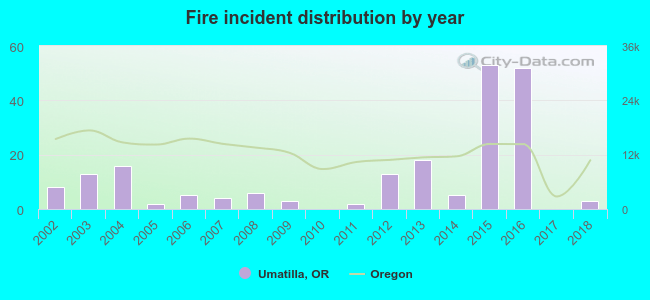 According to the data from the years 2002 - 2018 the average number of fire incidents per year is 12. The highest number of reported fire incidents - 53 took place in 2015, and the least - 0 in 2010. The data has a dropping trend.

 24.6% incidents where reported in the morning and 75.4% in the evening. The most fires (19.7%) took place on Monday, and the least (10.8%) on Thursday.
 Based on the 203 fires from years 2002 - 2018 most fires (25.1%) took place during July, and the least (1.5%) in January.
 Out of all 714 cases reported during the years 2002 - 2018, the most belonged to the categories: Rescue & EMS (53.1%), Fire (28.4%), and Good Intent Call (9.5%).
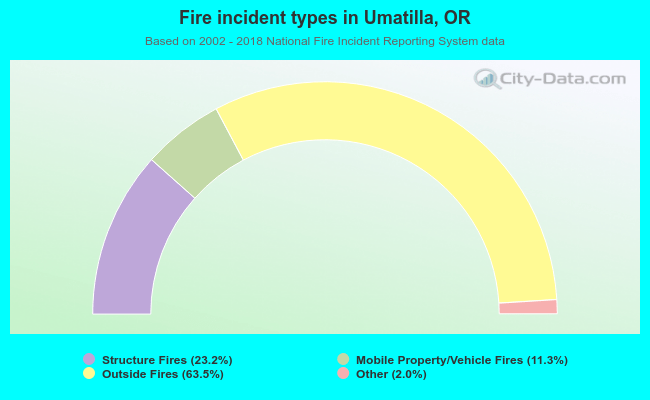 When looking into fire subcategories, the most reports belonged to: Outside Fires (63.5%), and Structure Fires (23.2%).