Tiburon: Fire Incidents, California (CA)
Where are fire incidents reported in Tiburon, CA
Something went wrong! Please refresh the page.
|
| |||||||||||||||||||||||||||||||||||||||||||||||||||||||||||||||||||||||||||||||||||||||||||||||||||||||||||||
2002 - 2018 National Fire Incident Reporting System (NFIRS) incidents
- Incident types reported to NFIRS in Tiburon, CA
- 3,01251.1%Rescue & EMS
- 91615.5%Service Call
- 63110.7%False Alarm
- 4698.0%Good Intent Call
- 4667.9%Hazardous Condition
- 3596.1%Fire
- 290.5%Severe Weather
- 80.1%Overpressure Rupture
- Fire incident types reported to NFIRS in Tiburon, CA
- 19153.2%Structure Fires
- 12534.8%Outside Fires
- 318.6%Mobile Property/Vehicle Fires
- 123.3%Other
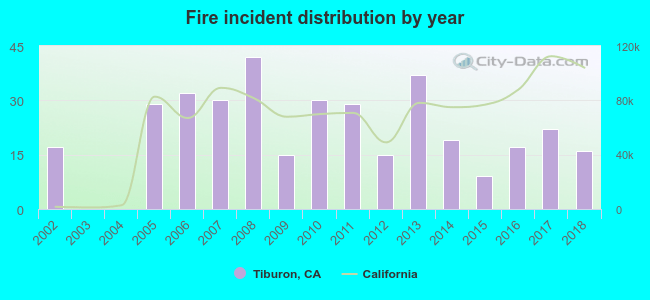 Based on the data from the years 2002 - 2018 the average number of fires per year is 21. The highest number of reported fires - 42 took place in 2008, and the least - 0 in 2003. The data has a decreasing trend.
The average number of yearly fire incidents per 10k residents in Tiburon, CA compared to nearest cities:
(Note: Based on data for the last 3 years, including only cities with population 5,000 and above)
| Tiburon: | 19.9 |
| Strawberry: | 6.2 |
| Sausalito: | 79.4 |
| Corte Madera: | 29.2 |
| Mill Valley: | 43.0 |
| Larkspur: | 14.9 |
| Kentfield: | 29.3 |
| San Rafael: | 28.9 |
| Richmond: | 41.0 |
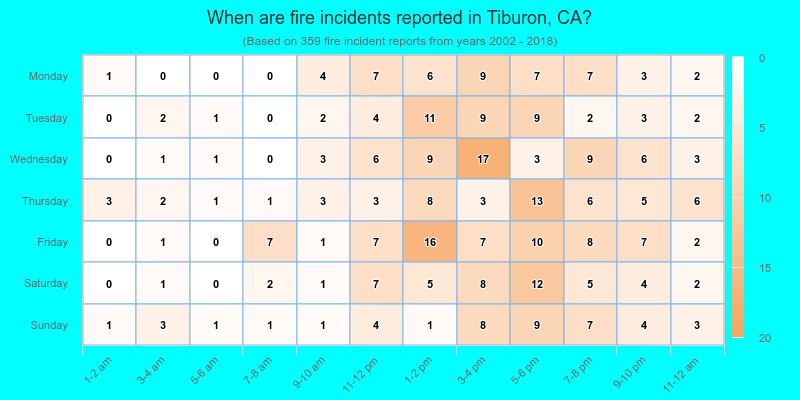
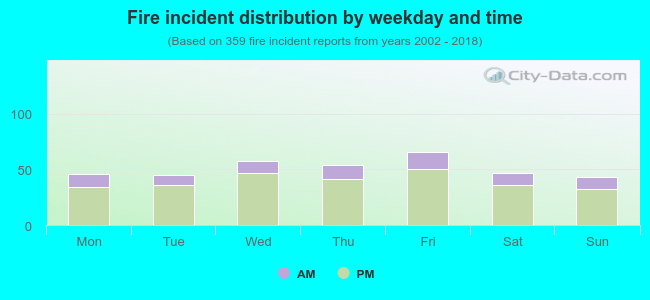 23.1% incidents where reported in the morning and 76.9% in the evening. The most fires (18.4%) took place on Friday, and the least (12.0%) on Sunday.
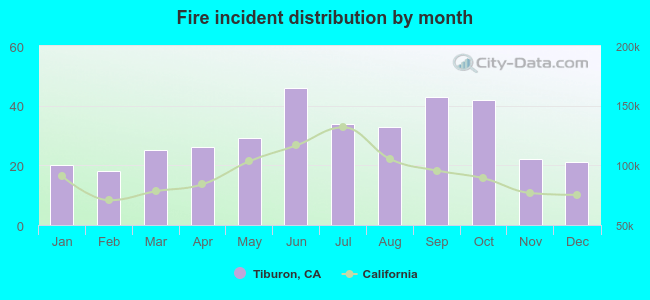 According to the 359 incident reports from years 2002 - 2018 most fires (12.8%) took place during June, and the least (5.0%) in February.
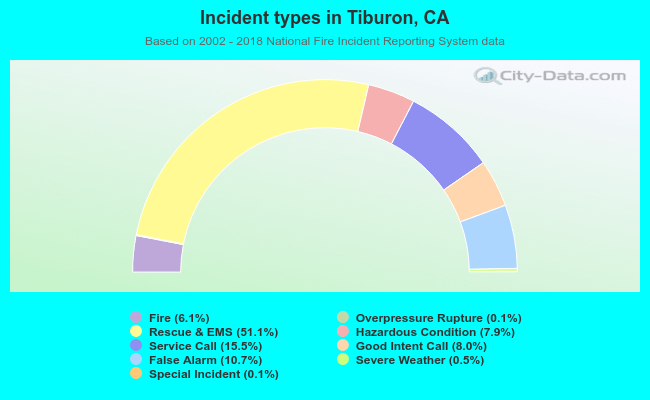 Out of all 5,895 cases reported during the years 2002 - 2018, the most belonged to the categories: Rescue & EMS (51.1%), Service Call (15.5%), and False Alarm (10.7%).
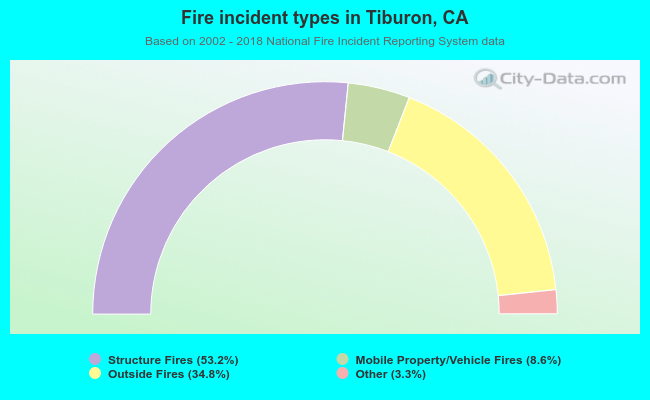 When looking into fire subcategories, the most incidents belonged to: Structure Fires (53.2%), and Outside Fires (34.8%).