Templeton: Fire Incidents, California (CA)
Where are fire incidents reported in Templeton, CA
Something went wrong! Please refresh the page.
|
| |||||||||||||||||||||||||||||||||||||||||||||||||||||||||||||||||||||||||||||||||||||||||||||||||||||||||||||
2005 - 2018 National Fire Incident Reporting System (NFIRS) incidents
- Incident types reported to NFIRS in Templeton, CA
- 2,03057.5%Rescue & EMS
- 44312.6%Fire
- 40211.4%Good Intent Call
- 3489.9%Service Call
- 1915.4%False Alarm
- 1083.1%Hazardous Condition
- Fire incident types reported to NFIRS in Templeton, CA
- 23954.0%Outside Fires
- 9421.2%Structure Fires
- 5512.4%Mobile Property/Vehicle Fires
- 5512.4%Other
 According to the data from the years 2005 - 2018 the average number of fire incidents per year is 32. The highest number of fire incidents - 62 took place in 2013, and the least - 14 in 2008. The data has a dropping trend.
The average number of yearly fire incidents per 10k residents in Templeton, CA compared to nearest cities:
(Note: Based on data for the last 3 years, including only cities with population 5,000 and above)
| Templeton: | 44.7 |
| Atascadero: | 15.8 |
| Paso Robles: | 29.8 |
| Morro Bay: | 3.8 |
| Los Osos: | 0.7 |
| San Luis Obispo: | 13.2 |
| Cambria: | 33.2 |
| Pismo Beach: | 9.2 |
| Grover Beach: | 0.7 |

 22.8% incidents where reported in the morning and 77.2% in the evening. The most fires (18.3%) took place on Saturday, and the least (11.1%) on Tuesday.
 Based on the 443 incident reports from years 2005 - 2018 most fires (21.9%) took place during July, and the least (3.6%) in February.
 Out of all 3,528 cases reported during the years 2005 - 2018, the most belonged to the categories: Rescue & EMS (57.5%), Fire (12.6%), and Good Intent Call (11.4%).
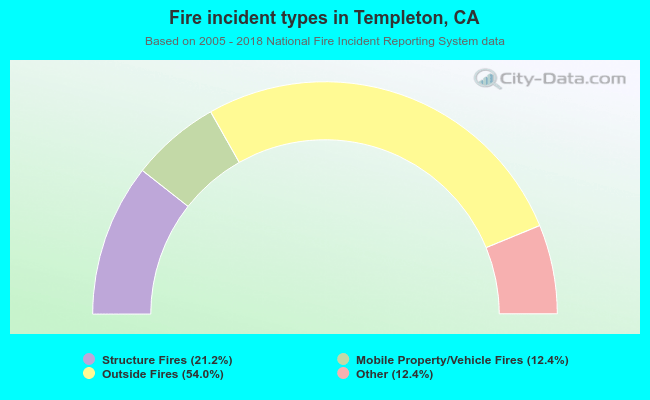 When looking into fire subcategories, the most reports belonged to: Outside Fires (54.0%), and Structure Fires (21.2%).