Tallulah: Fire Incidents, Louisiana (LA)
Where are fire incidents reported in Tallulah, LA
Something went wrong! Please refresh the page.
|
| |||||||||||||||||||||||||||||||||||||||||||||||||||||||||||||||||||||||||||||||||||||||||||||||||||||||||||||
| Other | 325 | |||||||||||||||||||||||||||||||||||||||||||||||||||||||||||||||||||||||||||||||||||||||||||||||||||||||||||||
2002 - 2018 National Fire Incident Reporting System (NFIRS) incidents
- Incident types reported to NFIRS in Tallulah, LA
- 93152.5%Fire
- 33118.7%False Alarm
- 27515.5%Hazardous Condition
- 1458.2%Service Call
- 613.4%Rescue & EMS
- 171.0%Good Intent Call
- 70.4%Special Incident
- 30.2%Severe Weather
- 20.1%Overpressure Rupture
- Fire incident types reported to NFIRS in Tallulah, LA
- 39342.2%Structure Fires
- 34637.2%Outside Fires
- 16717.9%Mobile Property/Vehicle Fires
- 252.7%Other
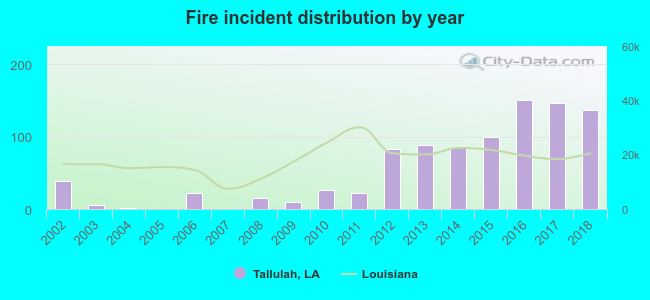 Based on the data from the years 2002 - 2018 the average number of fire incidents per year is 55. The highest number of reported fires - 150 took place in 2016, and the least - 0 in 2005. The data has a growing trend.
The average number of yearly fire incidents per 10k residents in Tallulah, LA compared to nearest cities:
(Note: Based on data for the last 3 years, including only cities with population 5,000 and above)
| Tallulah: | 201.0 |
| Bastrop: | 126.2 |
| Monroe: | 70.4 |
| West Monroe: | 210.8 |
 The median response time based on all reported fire incidents is 4 minutes. This is lower compared to the state median value.
The median response time in Tallulah, LA compared to nearest cities:
(Note: Based on data for all years, including only cities with at least 500 fire incidents)
| Tallulah: | 4 minutes |
| Delhi: | 8 minutes |
| Oak Grove: | 10 minutes |
| Rayville: | 5 minutes |
| Winnsboro: | 6 minutes |
| Eudora: | 10 minutes |
| Bastrop: | 4 minutes |
| Monroe: | 5 minutes |
| West Monroe: | 6 minutes |
 32.0% incidents where reported in the morning and 68.0% in the evening. The most fires (17.8%) took place on Tuesday, and the least (11.8%) on Saturday.
 According to the 931 fire incident reports from years 2002 - 2018 most fires (10.2%) took place during July, and the least (6.3%) in April.
 Out of all 1,772 cases reported during the years 2002 - 2018, the most belonged to the categories: Fire (52.5%), False Alarm (18.7%), and Hazardous Condition (15.5%).
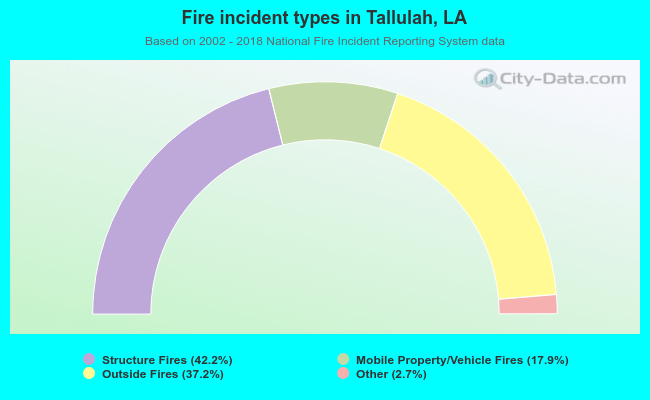 When looking into fire subcategories, the most incidents belonged to: Structure Fires (42.2%), and Outside Fires (37.2%).