Stickney: Fire Incidents, Illinois (IL)
Where are fire incidents reported in Stickney, IL
Something went wrong! Please refresh the page.
|
| |||||||||||||||||||||||||||||||||||||||||||||||||||||||||||||||||||||||||||||||||||||||||||||||||||||||||||||
2002 - 2018 National Fire Incident Reporting System (NFIRS) incidents
- Incident types reported to NFIRS in Stickney, IL
- 2,91750.3%Rescue & EMS
- 87615.1%False Alarm
- 59410.3%Good Intent Call
- 5709.8%Fire
- 5379.3%Hazardous Condition
- 2905.0%Service Call
- 60.1%Overpressure Rupture
- Fire incident types reported to NFIRS in Stickney, IL
- 23441.1%Structure Fires
- 17931.4%Outside Fires
- 9216.1%Mobile Property/Vehicle Fires
- 6511.4%Other
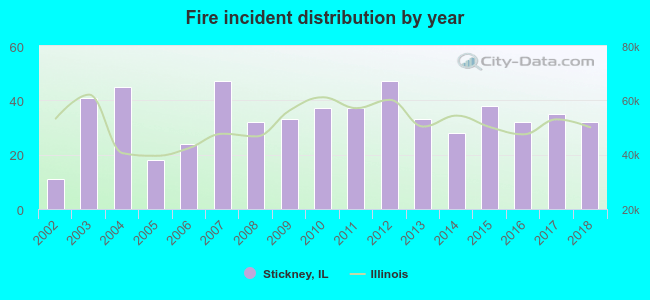 Based on the data from the years 2002 - 2018 the average number of fire incidents per year is 34. The highest number of fires - 47 took place in 2007, and the least - 11 in 2002. The data has an increasing trend.
The average number of yearly fire incidents per 10k residents in Stickney, IL compared to nearest cities:
(Note: Based on data for the last 3 years, including only cities with population 5,000 and above)
| Stickney: | 48.4 |
| Berwyn: | 23.0 |
| Riverside: | 20.6 |
| Lyons: | 67.8 |
| Cicero: | 25.7 |
| Summit: | 57.7 |
| North Riverside: | 31.4 |
| Brookfield: | 36.6 |
| Forest Park: | 45.8 |
 The median response time based on all reported fire incidents is 5 minutes. This is comparable to the Illinois median value.
The median response time in Stickney, IL compared to nearest cities:
(Note: Based on data for all years, including only cities with at least 500 fire incidents)
| Stickney: | 5 minutes |
| Berwyn: | 3 minutes |
| Riverside: | 6 minutes |
| Lyons: | 5 minutes |
| Cicero: | 3 minutes |
| Summit: | 5 minutes |
| Brookfield: | 5 minutes |
| Bedford Park: | 5 minutes |
| Forest Park: | 5 minutes |
 37.5% incidents where reported in the morning and 62.5% in the evening. The most fires (16.3%) took place on Friday, and the least (11.1%) on Tuesday.
 Based on the 570 fire incidents from years 2002 - 2018 most fires (11.2%) took place during June, and the least (4.7%) in August.
 Out of all 5,795 cases reported during the years 2002 - 2018, the most belonged to the categories: Rescue & EMS (50.3%), False Alarm (15.1%), and Good Intent Call (10.3%).
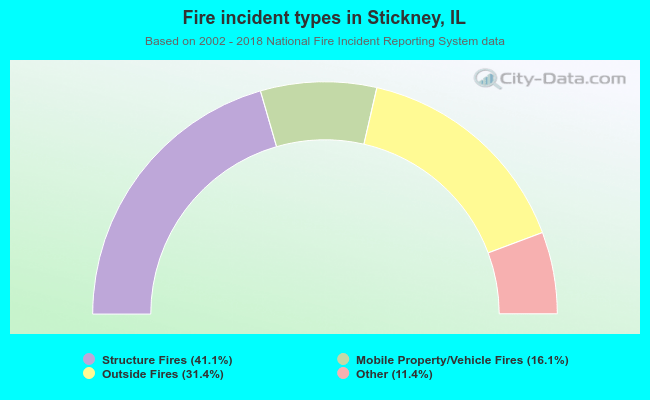 When looking into fire subcategories, the most reports belonged to: Structure Fires (41.1%), and Outside Fires (31.4%).