Sebastopol: Fire Incidents, California (CA)
Where are fire incidents reported in Sebastopol, CA
Something went wrong! Please refresh the page.
|
| |||||||||||||||||||||||||||||||||||||||||||||||||||||||||||||||||||||||||||||||||||||||||||||||||||||||||||||
| Other | 161 | |||||||||||||||||||||||||||||||||||||||||||||||||||||||||||||||||||||||||||||||||||||||||||||||||||||||||||||
2005 - 2018 National Fire Incident Reporting System (NFIRS) incidents
- Incident types reported to NFIRS in Sebastopol, CA
- 2,69051.1%Rescue & EMS
- 80915.4%Good Intent Call
- 62411.9%Hazardous Condition
- 53710.2%Fire
- 3887.4%Service Call
- 2013.8%False Alarm
- 70.1%Special Incident
- Fire incident types reported to NFIRS in Sebastopol, CA
- 25848.0%Outside Fires
- 16530.7%Structure Fires
- 7213.4%Other
- 427.8%Mobile Property/Vehicle Fires
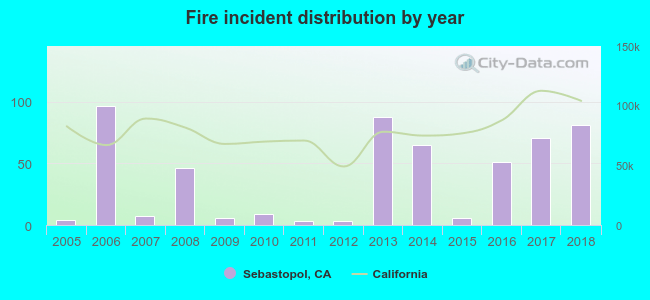 According to the data from the years 2005 - 2018 the average number of fires per year is 38. The highest number of fire incidents - 97 took place in 2006, and the least - 3 in 2011. The data has a rising trend.
The average number of yearly fire incidents per 10k residents in Sebastopol, CA compared to nearest cities:
(Note: Based on data for the last 3 years, including only cities with population 5,000 and above)
| Sebastopol: | 88.3 |
| Roseland: | 18.2 |
| Santa Rosa: | 17.5 |
| Rohnert Park: | 6.6 |
| Cotati: | 39.0 |
| Windsor: | 13.4 |
| Petaluma: | 19.7 |
| Healdsburg: | 46.6 |
| Calistoga: | 9.4 |
 The median response time based on all reported fire incidents is 9 minutes. This is higher compared to the state median value.
The median response time in Sebastopol, CA compared to nearest cities:
(Note: Based on data for all years, including only cities with at least 500 fire incidents)
| Sebastopol: | 9 minutes |
| Forestville: | 9 minutes |
| Santa Rosa: | 6 minutes |
| Cotati: | 6 minutes |
| Windsor: | 6 minutes |
| Petaluma: | 7 minutes |
| Healdsburg: | 8 minutes |
| Sonoma: | 8 minutes |
| Novato: | 6 minutes |
 27.9% incidents where reported in the morning and 72.1% in the evening. The most fires (17.9%) took place on Saturday, and the least (12.5%) on Monday.
 According to the 537 incident reports from years 2005 - 2018 most fires (14.7%) took place during July, and the least (4.8%) in February.
 Out of all 5,262 cases reported during the years 2005 - 2018, the most belonged to the categories: Rescue & EMS (51.1%), Good Intent Call (15.4%), and Hazardous Condition (11.9%).
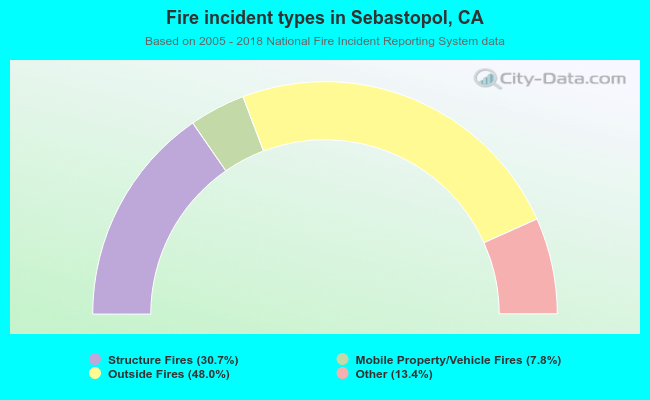 When looking into fire subcategories, the most incidents belonged to: Outside Fires (48.0%), and Structure Fires (30.7%).