Schiller Park: Fire Incidents, Illinois (IL)
Where are fire incidents reported in Schiller Park, IL
Something went wrong! Please refresh the page.
| Fire incidents reported | |
|---|---|
| Sreet name | Count |
| IRVING PARK RD | 150 |
| RIVER RD | 70 |
| 25TH AVE | 66 |
| MANNHEIM RD | 54 |
| HARTFORD CT | 44 |
| LAWRENCE AVE | 44 |
| WESLEY TER | 44 |
| RUBY ST | 40 |
| BYRON ST | 36 |
| ROSE ST | 36 |
| KOLZE AVE | 34 |
| LAWRENCE | 32 |
| SORENG AVE | 30 |
| IVANHOE AVE | 28 |
| LAWRENCE CT | 28 |
| KELVIN LA | 24 |
| TRANSWORLD DR | 22 |
| RIVER ST | 20 |
| SORENG | 20 |
| WESLEY TERRACE | 20 |
| OLD RIVER RD | 18 |
| SCOTT ST | 18 |
| UNITED PKY | 18 |
| 25TH | 16 |
| AINSLIE ST | 16 |
| BERNICE AVE | 16 |
| DENLEY AVE | 16 |
| HAROLD AVE | 16 |
| IVANHOE | 16 |
| LELAND AVE | 16 |
2002 - 2018 National Fire Incident Reporting System (NFIRS) incidents
- Incident types reported to NFIRS in Schiller Park, IL
- 5,52250.5%Rescue & EMS
- 1,96518.0%False Alarm
- 1,18710.9%Good Intent Call
- 9478.7%Hazardous Condition
- 9358.6%Fire
- 3543.2%Service Call
- Fire incident types reported to NFIRS in Schiller Park, IL
- 47550.8%Structure Fires
- 21022.5%Mobile Property/Vehicle Fires
- 17318.5%Outside Fires
- 778.2%Other
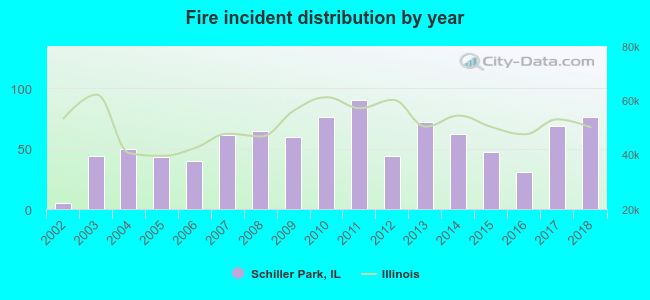 According to the data from the years 2002 - 2018 the average number of fires per year is 55. The highest number of reported fire incidents - 90 took place in 2011, and the least - 5 in 2002. The data has a growing trend.
The average number of yearly fire incidents per 10k residents in Schiller Park, IL compared to nearest cities:
(Note: Based on data for the last 3 years, including only cities with population 5,000 and above)
| Schiller Park: | 49.5 |
| Franklin Park: | 39.5 |
| Norridge: | 11.8 |
| River Grove: | 29.2 |
| Northlake: | 33.7 |
| Harwood Heights: | 22.5 |
| Elmwood Park: | 26.3 |
| Bensenville: | 55.9 |
| Melrose Park: | 35.1 |
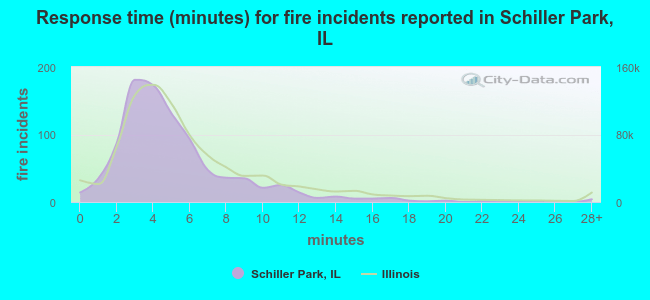 The median response time based on all reported fire incidents is 4 minutes. This is lower compared to the Illinois median value.
The median response time in Schiller Park, IL compared to nearest cities:
(Note: Based on data for all years, including only cities with at least 500 fire incidents)
| Schiller Park: | 4 minutes |
| Franklin Park: | 4 minutes |
| River Grove: | 4 minutes |
| Northlake: | 5 minutes |
| Elmwood Park: | 5 minutes |
| Bensenville: | 6 minutes |
| Melrose Park: | 4 minutes |
| Park Ridge: | 5 minutes |
| Bellwood: | 3 minutes |
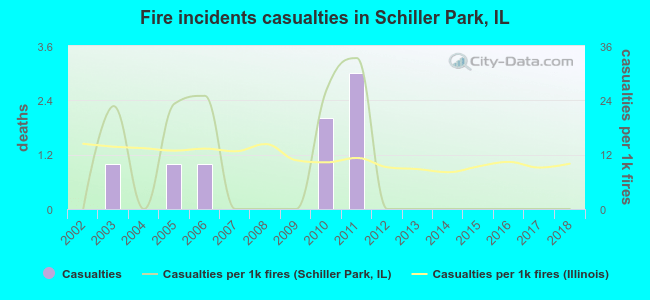 According to the reports from the years 2002 - 2018 the average number of fire-related casualties per year is 0. The highest number of casualties - 3 took place in 2011, and the lowest - 0 in 2002. The data has a constant trend.
The average number of injuries per 1,000 fires is 8. This indicator was the highest - 33 in 2011, and the lowest 0 in 2002. The trend for injuries per 1,000 fire incidents is constant. Compared to the state value the number of injuries per 1,000 fires is lower.
According to the reports from the years 2002 - 2018 the average number of fire-related casualties per year is 0. The highest number of casualties - 3 took place in 2011, and the lowest - 0 in 2002. The data has a constant trend.
The average number of injuries per 1,000 fires is 8. This indicator was the highest - 33 in 2011, and the lowest 0 in 2002. The trend for injuries per 1,000 fire incidents is constant. Compared to the state value the number of injuries per 1,000 fires is lower.Casualties per 1,000 incidents in Schiller Park, IL compared to nearest cities:
(Note: Based on data for all years, including only cities with at least 500 fire incidents)
| Schiller Park: | 8.6 |
| Franklin Park: | 15.4 |
| River Grove: | 3.1 |
| Northlake: | 4.7 |
| Elmwood Park: | 3.5 |
| Bensenville: | 8.9 |
| Melrose Park: | 12.3 |
| Park Ridge: | 16.8 |
| Bellwood: | 5.1 |
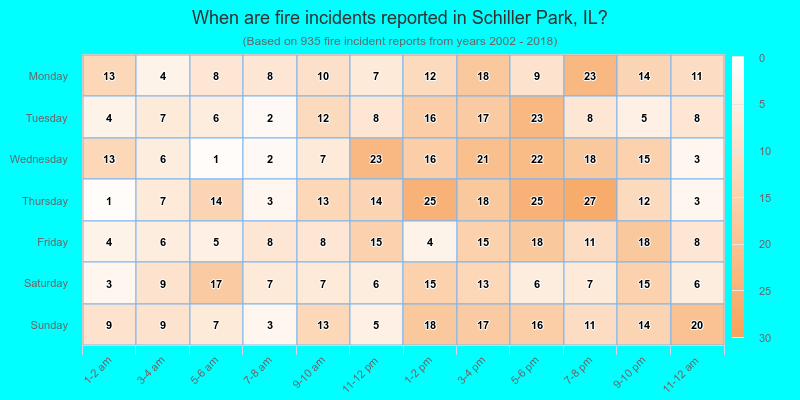
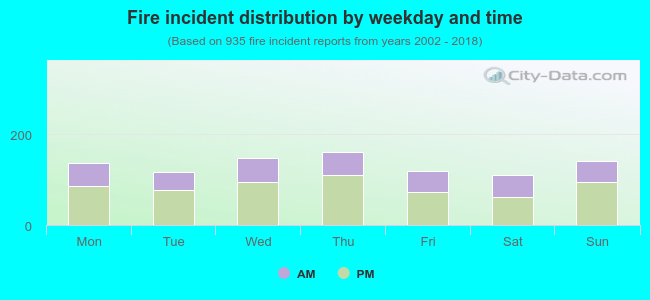 35.7% incidents where reported in the morning and 64.3% in the evening. The most fires (17.3%) took place on Thursday, and the least (11.9%) on Saturday.
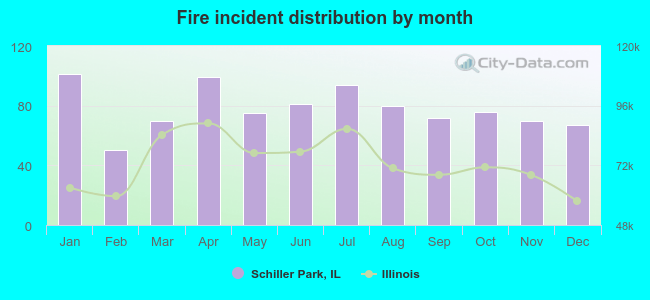 Based on the 935 fire incidents from years 2002 - 2018 most fires (10.8%) took place during January, and the least (5.3%) in February.
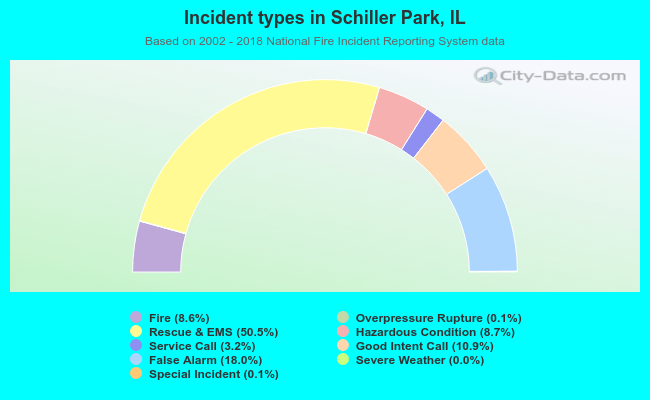 Out of all 10,926 cases reported during the years 2002 - 2018, the most belonged to the categories: Rescue & EMS (50.5%), False Alarm (18.0%), and Good Intent Call (10.9%).
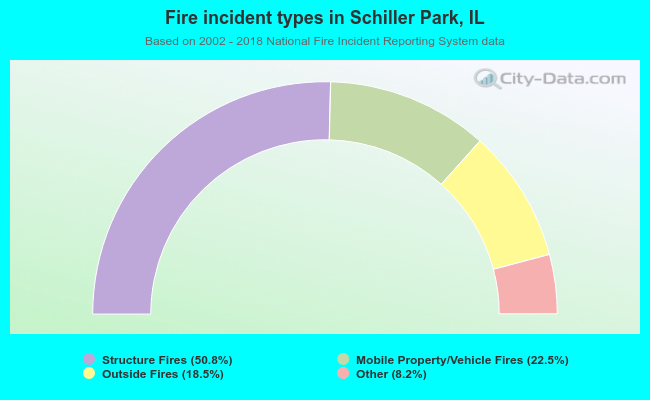 When looking into fire subcategories, the most incidents belonged to: Structure Fires (50.8%), and Mobile Property/Vehicle Fires (22.5%).