Santa Clarita: Fire Incidents, California (CA)
Where are fire incidents reported in Santa Clarita, CA
Something went wrong! Please refresh the page.
| Fire incidents reported | |
|---|---|
| Sreet name | Count |
| SOLEDAD CANYON | 372 |
| BOUQUET CANYON | 196 |
| SIERRA | 172 |
| MCBEAN PKY | 104 |
| RAILROAD | 86 |
| VALENCIA | 84 |
| NEWHALL | 82 |
| LYONS | 80 |
| GOLDEN VALLEY | 78 |
| WILEY CANYON | 70 |
| NEWHALL RANCH | 64 |
| SAND CANYON | 56 |
| MAGIC MOUNTAIN PKY | 50 |
| NB 5 SO CALGROVE | 38 |
| VIA PRINCESSA | 38 |
| DEL MONTE | 30 |
| WALNUT | 30 |
| 12500 W PAXTON ST X N LOPEZ CA | 28 |
| NB 14 NO 5 | 28 |
| NB 14 SO GOLDEN VALLEY | 28 |
| PLACERITA CANYON | 28 |
| SECO CANYON | 28 |
| VALLE DEL ORO | 28 |
| AVENUE OF THE OAKS | 26 |
| SB 5 SO CALGROVE | 26 |
| CAMP PLENTY | 24 |
| NB 14 SO NEWHALL | 24 |
| DELIGHT | 22 |
| PLUM CANYON | 22 |
| ROCKWELL CANYON | 22 |
| Other | 637 |
2005 - 2018 National Fire Incident Reporting System (NFIRS) incidents
- Incident types reported to NFIRS in Santa Clarita, CA
- 38,33362.4%Rescue & EMS
- 12,08119.7%Good Intent Call
- 4,2466.9%False Alarm
- 2,8714.7%Service Call
- 2,6014.2%Fire
- 1,1661.9%Hazardous Condition
- 920.1%Special Incident
- Fire incident types reported to NFIRS in Santa Clarita, CA
- 1,09342.0%Outside Fires
- 65625.2%Structure Fires
- 63824.5%Mobile Property/Vehicle Fires
- 2148.2%Other
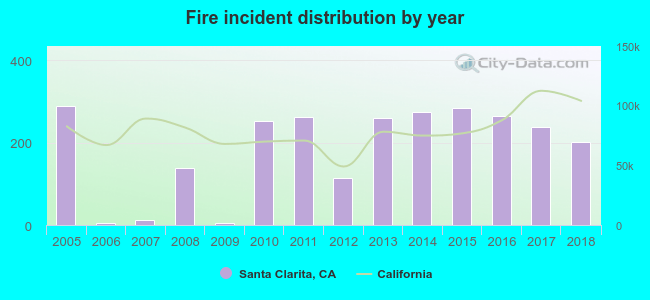 Based on the data from the years 2005 - 2018 the average number of fire incidents per year is 186. The highest number of reported fire incidents - 290 took place in 2005, and the least - 4 in 2009. The data has a dropping trend.
The average number of yearly fire incidents per 10k residents in Santa Clarita, CA compared to nearest cities:
(Note: Based on data for the last 3 years, including only cities with population 5,000 and above)
| Santa Clarita: | 12.9 |
| Newhall: | 0.1 |
| Stevenson Ranch: | 6.6 |
| Castaic: | 21.7 |
| San Fernando: | 4.9 |
| Simi Valley: | 13.7 |
| Acton: | 64.1 |
| Burbank: | 18.2 |
| Calabasas: | 15.5 |
 The median response time based on all reported fire incidents is 5 minutes. This is lower than the California median value.
The median response time in Santa Clarita, CA compared to nearest cities:
(Note: Based on data for all years, including only cities with at least 500 fire incidents)
| Santa Clarita: | 5 minutes |
| Simi Valley: | 6 minutes |
| Burbank: | 4 minutes |
| Glendale: | 5 minutes |
| Moorpark: | 7 minutes |
| West Hollywood: | 4 minutes |
| Los Angeles: | 5 minutes |
| Beverly Hills: | 5 minutes |
| Palmdale: | 5 minutes |
 28.9% incidents where reported in the morning and 71.1% in the evening. The most fires (14.9%) took place on Saturday, and the least (13.9%) on Thursday.
 According to the 2,601 reports from years 2005 - 2018 most fires (10.8%) took place during June, and the least (6.7%) in December.
 Out of all 61,449 cases reported during the years 2005 - 2018, the most belonged to the categories: Rescue & EMS (62.4%), Good Intent Call (19.7%), and False Alarm (6.9%).
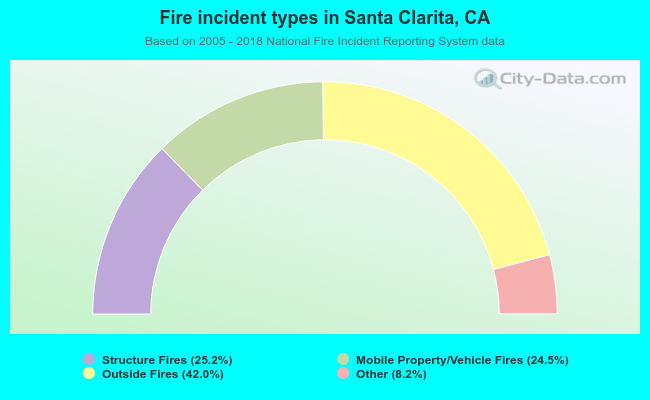 When looking into fire subcategories, the most reports belonged to: Outside Fires (42.0%), and Structure Fires (25.2%).