San Anselmo: Fire Incidents, California (CA)
Where are fire incidents reported in San Anselmo, CA
Something went wrong! Please refresh the page.
|
| |||||||||||||||||||||||||||||||||||||||||||||||||||||||||||||||||||||||||||||||||||||||||||||||||||||||||||||
2002 - 2018 National Fire Incident Reporting System (NFIRS) incidents
- Incident types reported to NFIRS in San Anselmo, CA
- 2,91247.4%Rescue & EMS
- 1,00016.3%Service Call
- 83713.6%Good Intent Call
- 5248.5%Hazardous Condition
- 4767.7%False Alarm
- 3706.0%Fire
- 110.2%Special Incident
- 100.2%Overpressure Rupture
- Fire incident types reported to NFIRS in San Anselmo, CA
- 18951.1%Structure Fires
- 12032.4%Outside Fires
- 318.4%Other
- 308.1%Mobile Property/Vehicle Fires
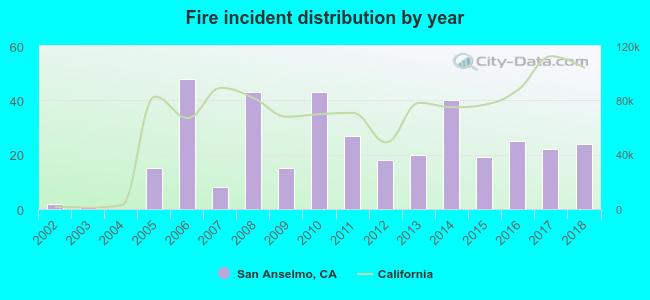 According to the data from the years 2002 - 2018 the average number of fire incidents per year is 22. The highest number of reported fires - 48 took place in 2006, and the least - 0 in 2004. The data has an increasing trend.
The average number of yearly fire incidents per 10k residents in San Anselmo, CA compared to nearest cities:
(Note: Based on data for the last 3 years, including only cities with population 5,000 and above)
| San Anselmo: | 18.7 |
| Fairfax: | 24.4 |
| Kentfield: | 29.3 |
| San Rafael: | 28.9 |
| Larkspur: | 14.9 |
| Corte Madera: | 29.2 |
| Mill Valley: | 43.0 |
| Strawberry: | 6.2 |
| Novato: | 15.0 |

 Based on the reports from the years 2002 - 2018 the average number of fire-related yearly casualties is 0. The highest number of injuries - 2 took place in 2006, and the lowest - 0 in 2002. The data has a constant trend.
 30.3% incidents where reported in the morning and 69.7% in the evening. The most fires (18.9%) took place on Saturday, and the least (11.4%) on Monday.
 According to the 370 fire incidents from years 2002 - 2018 most fires (10.8%) took place during August, and the least (5.4%) in December.
 Out of all 6,144 cases reported during the years 2002 - 2018, the most belonged to the categories: Rescue & EMS (47.4%), Service Call (16.3%), and Good Intent Call (13.6%).
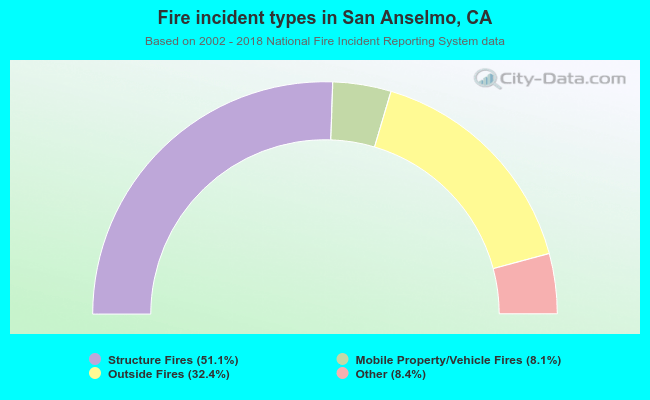 When looking into fire subcategories, the most incidents belonged to: Structure Fires (51.1%), and Outside Fires (32.4%).