Rock Springs: Fire Incidents, Wyoming (WY)
Where are fire incidents reported in Rock Springs, WY
Something went wrong! Please refresh the page.
| Fire incidents reported | |
|---|---|
| Sreet name | Count |
| ELK ST | 150 |
| 9TH ST | 88 |
| DEWAR DR | 78 |
| FOOTHILL BLVD | 74 |
| I 80 FWY | 70 |
| US 191 HWY | 62 |
| SWANSON DR | 48 |
| YELLOWSTONE RD | 44 |
| I-80 FWY | 42 |
| PURPLE SAGE RD | 32 |
| SUNSET DR | 28 |
| GATEWAY BLVD | 26 |
| US 430 HWY | 26 |
| CENTER ST | 24 |
| CENTURY BLVD | 24 |
| INTERSTATE 80 | 24 |
| WALNUT ST | 24 |
| COLLEGE DR | 22 |
| COMMUNITY PARK DR | 22 |
| GOBEL ST | 22 |
| IMPERIAL DR | 20 |
| INTERSTATE 80 EB | 20 |
| SPRINGS DR | 20 |
| 191 HWY | 18 |
| BLAIR AVE | 18 |
| INTERSTATE 80 WB | 18 |
| MADISON DR | 18 |
| C ST | 16 |
| ELIAS AVE | 16 |
| ANTELOPE DR | 14 |
| Other | 340 |
2002 - 2018 National Fire Incident Reporting System (NFIRS) incidents
- Incident types reported to NFIRS in Rock Springs, WY
- 7,95259.7%Rescue & EMS
- 1,65812.4%Hazardous Condition
- 1,44810.9%Fire
- 9146.9%False Alarm
- 6965.2%Service Call
- 6204.7%Good Intent Call
- 210.2%Special Incident
- Fire incident types reported to NFIRS in Rock Springs, WY
- 65245.0%Outside Fires
- 43630.1%Structure Fires
- 28920.0%Mobile Property/Vehicle Fires
- 714.9%Other
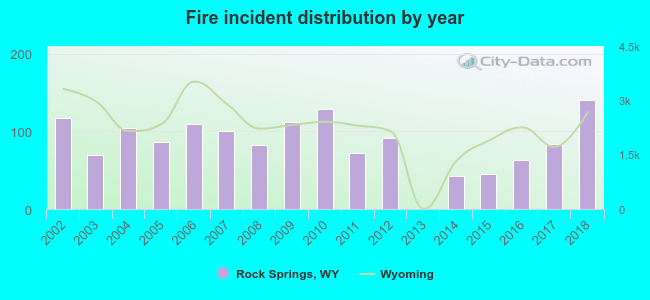 According to the data from the years 2002 - 2018 the average number of fires per year is 85. The highest number of reported fires - 140 took place in 2018, and the least - 0 in 2013. The data has an increasing trend.
The average number of yearly fire incidents per 10k residents in Rock Springs, WY compared to nearest cities:
(Note: Based on data for the last 3 years, including only cities with population 5,000 and above)
| Rock Springs: | 39.8 |
| Green River: | 27.7 |
| Lander: | 61.9 |
| Evanston: | 13.4 |
| Rawlins: | 53.5 |
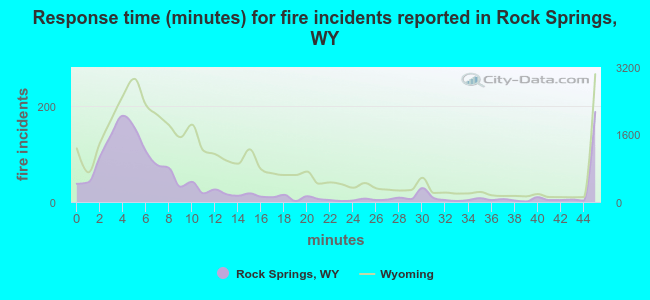 The median response time based on all reported fire incidents is 6 minutes. This is lower than the state median value.
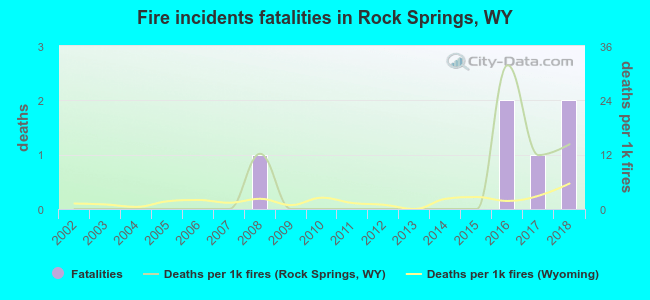 According to the data from the years 2002 - 2018 the average number of fire-related fatalities per year is 0. The highest number of reported deaths - 2 took place in 2016, and the lowest - 0 in 2002. The data has a growing trend.
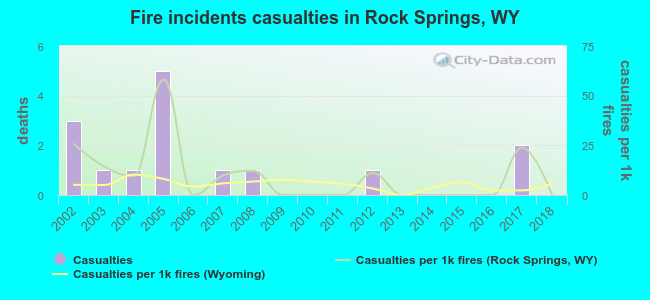 Based on the reports from the years 2002 - 2018 the average number of fire-related yearly casualties is 1. The highest number of casualties - 5 took place in 2005, and the lowest - 0 in 2006. The data has a declining trend.
The average number of injuries per 1,000 fire incidents is 10. This indicator was the highest - 58 in 2005, and the lowest 0 in 2006. The trend for casualties per 1,000 fire incidents is decreasing. Compared to the state value the number of injuries per 1,000 fires is higher.
Based on the reports from the years 2002 - 2018 the average number of fire-related yearly casualties is 1. The highest number of casualties - 5 took place in 2005, and the lowest - 0 in 2006. The data has a declining trend.
The average number of injuries per 1,000 fire incidents is 10. This indicator was the highest - 58 in 2005, and the lowest 0 in 2006. The trend for casualties per 1,000 fire incidents is decreasing. Compared to the state value the number of injuries per 1,000 fires is higher.
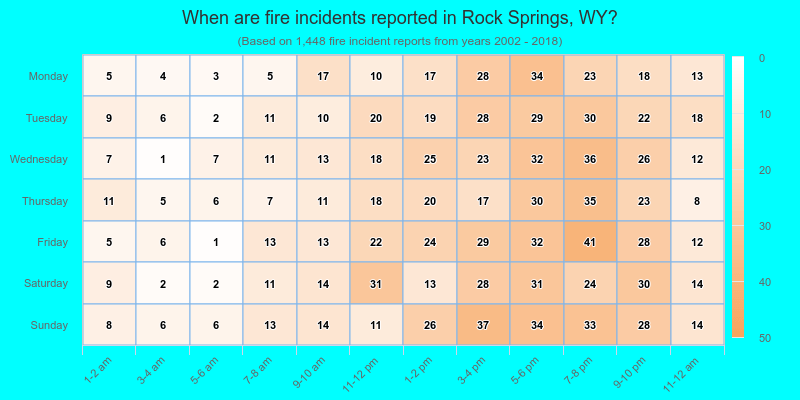
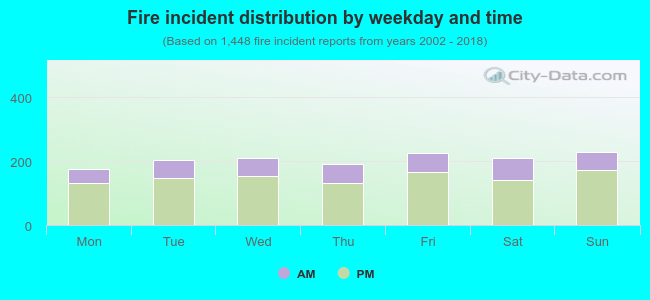 27.9% incidents where reported in the morning and 72.1% in the evening. The most fires (15.9%) took place on Sunday, and the least (12.2%) on Monday.
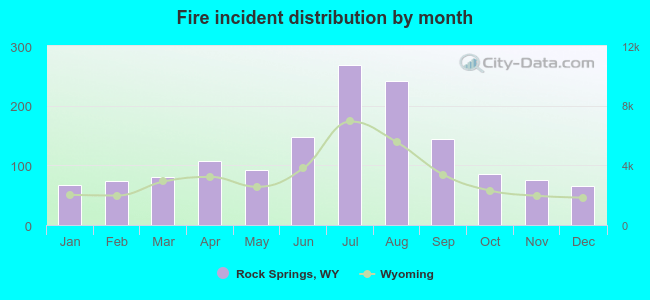 According to the 1,448 fires from years 2002 - 2018 most fires (18.5%) took place during July, and the least (4.5%) in December.
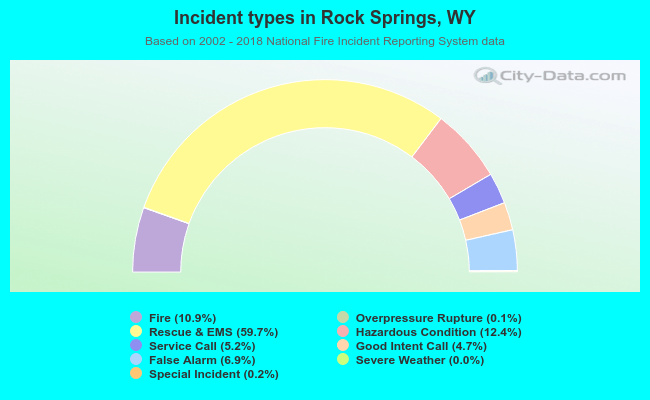 Out of all 13,323 cases reported during the years 2002 - 2018, the most belonged to the categories: Rescue & EMS (59.7%), Hazardous Condition (12.4%), and Fire (10.9%).
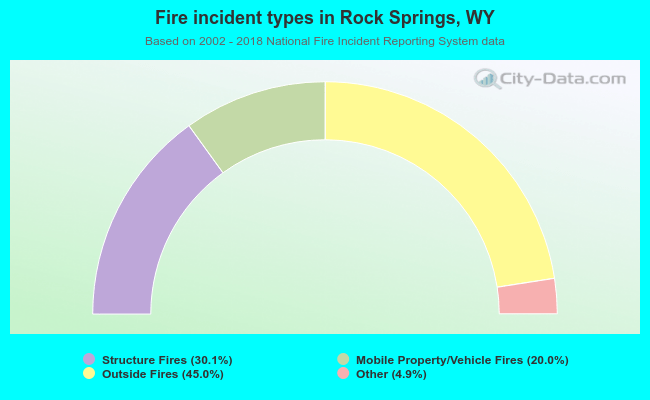 When looking into fire subcategories, the most reports belonged to: Outside Fires (45.0%), and Structure Fires (30.1%).