Roanoke Rapids: Fire Incidents, North Carolina (NC)
Where are fire incidents reported in Roanoke Rapids, NC
Something went wrong! Please refresh the page.
| Fire incidents reported | |
|---|---|
| Sreet name | Count |
| ROANOKE AVE | 72 |
| GASTON RD | 62 |
| THELMA ROAD | 58 |
| HWY 158 | 50 |
| MONROE ST | 44 |
| HWY 158 ROAD | 42 |
| HAMILTON ST | 38 |
| HENRY ST | 38 |
| JULIAN ALLSBROOK HWY | 38 |
| VANCE ST | 34 |
| OLD FARM RD | 32 |
| MADISON ST | 30 |
| JEFFERSON ST | 28 |
| FRANKLIN ST | 26 |
| BOLLING RD | 24 |
| JACKSON ST | 24 |
| JULIAN R ALLSBROOK HWY | 22 |
| BRANCH AVE | 20 |
| HUCKLEBERRY BOTTOM ROAD | 20 |
| SAMPOWELL DAIRY ROAD | 20 |
| TENTH ST | 20 |
| WASHINGTON ST | 20 |
| BECKER DR | 18 |
| HINSON ST | 18 |
| OAKLEY AVE | 18 |
| PREMIER BLVD | 18 |
| 10TH ST | 16 |
| CHALONER DR | 16 |
| CHARLOTTE ST | 16 |
| DAVIE SCHOOL RD | 16 |
| Other | 1,465 |
2002 - 2018 National Fire Incident Reporting System (NFIRS) incidents
- Incident types reported to NFIRS in Roanoke Rapids, NC
- 4,90736.2%Rescue & EMS
- 4,20831.1%Hazardous Condition
- 2,36317.4%Fire
- 8666.4%False Alarm
- 6735.0%Good Intent Call
- 3802.8%Service Call
- 1130.8%Special Incident
- 180.1%Overpressure Rupture
- 180.1%Severe Weather
- Fire incident types reported to NFIRS in Roanoke Rapids, NC
- 87437.0%Outside Fires
- 85536.2%Structure Fires
- 35615.1%Mobile Property/Vehicle Fires
- 27811.8%Other
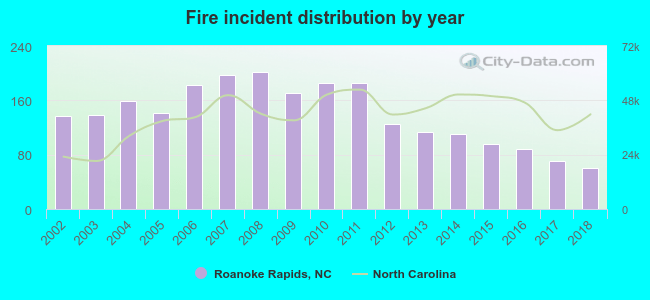 Based on the data from the years 2002 - 2018 the average number of fires per year is 139. The highest number of fire incidents - 202 took place in 2008, and the least - 60 in 2018. The data has a dropping trend.
The average number of yearly fire incidents per 10k residents in Roanoke Rapids, NC compared to nearest cities:
(Note: Based on data for the last 3 years, including only cities with population 5,000 and above)
| Roanoke Rapids: | 47.1 |
| Rocky Mount: | 52.5 |
| Nashville: | 157.4 |
| Tarboro: | 72.2 |
| Henderson: | 187.8 |
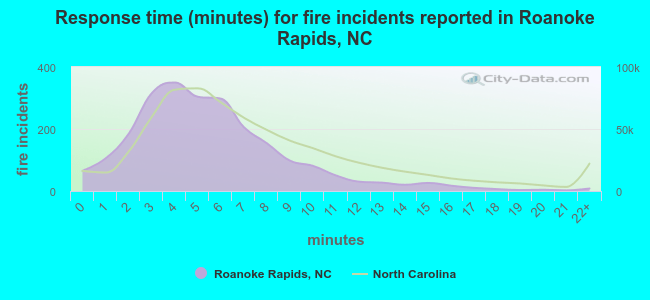 The median response time based on all reported fire incidents is 5 minutes. This is lower than the North Carolina median value.
The median response time in Roanoke Rapids, NC compared to nearest cities:
(Note: Based on data for all years, including only cities with at least 500 fire incidents)
| Roanoke Rapids: | 5 minutes |
| Weldon: | 4 minutes |
| Littleton: | 9 minutes |
| Enfield: | 11 minutes |
| Whitakers: | 12 minutes |
| Scotland Neck: | 7 minutes |
| Rocky Mount: | 5 minutes |
| Nashville: | 9 minutes |
| Tarboro: | 5 minutes |
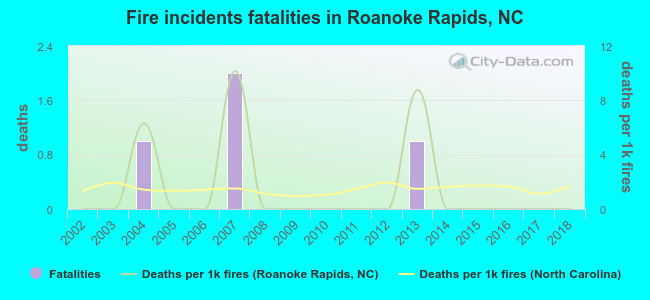 According to the reports from the years 2002 - 2018 the average number of fire-related fatalities per year is 0. The highest number of reported deaths - 2 took place in 2007, and the lowest - 0 in 2002. The data has a constant trend.
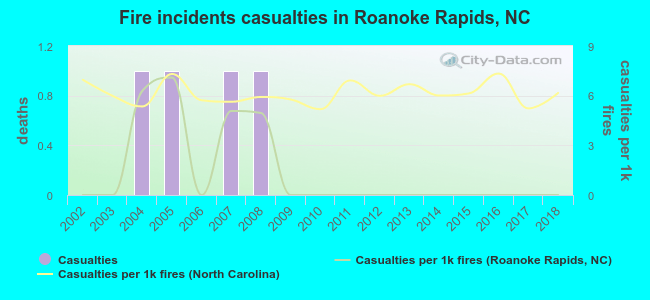 Based on the reports from the years 2002 - 2018 the average number of fire-related casualties per year is 0. The highest number of reported casualties - 1 took place in 2004, and the lowest - 0 in 2002. The data has a constant trend.
The average number of casualties per 1,000 fire incidents is 1. This indicator was the highest - 7 in 2005, and the lowest 0 in 2002. The trend for injuries per 1,000 fires is constant. Compared to the state value the number of injuries per 1,000 incidents is much lower.
Based on the reports from the years 2002 - 2018 the average number of fire-related casualties per year is 0. The highest number of reported casualties - 1 took place in 2004, and the lowest - 0 in 2002. The data has a constant trend.
The average number of casualties per 1,000 fire incidents is 1. This indicator was the highest - 7 in 2005, and the lowest 0 in 2002. The trend for injuries per 1,000 fires is constant. Compared to the state value the number of injuries per 1,000 incidents is much lower.Casualties per 1,000 incidents in Roanoke Rapids, NC compared to nearest cities:
(Note: Based on data for all years, including only cities with at least 500 fire incidents)
| Roanoke Rapids: | 1.7 |
| Weldon: | 3.7 |
| Littleton: | 0.0 |
| Enfield: | 0.7 |
| Whitakers: | 1.3 |
| Scotland Neck: | 4.6 |
| Rocky Mount: | 10.3 |
| Nashville: | 5.6 |
| Tarboro: | 3.2 |
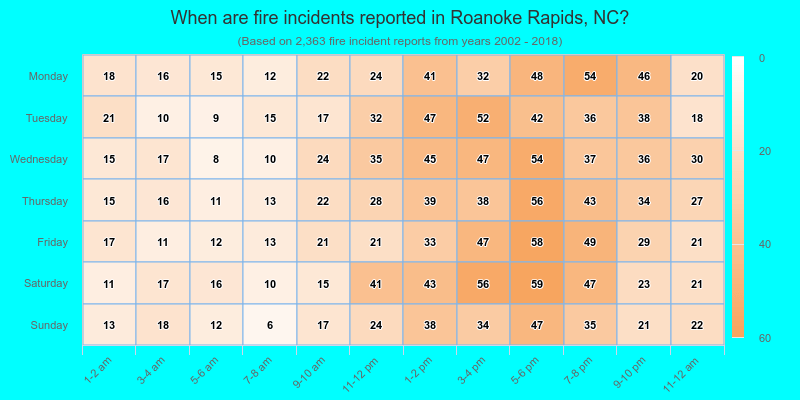
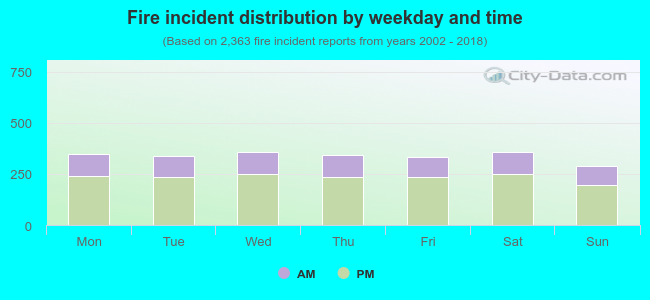 30.5% incidents where reported in the morning and 69.5% in the evening. The most fires (15.2%) took place on Saturday, and the least (12.1%) on Sunday.
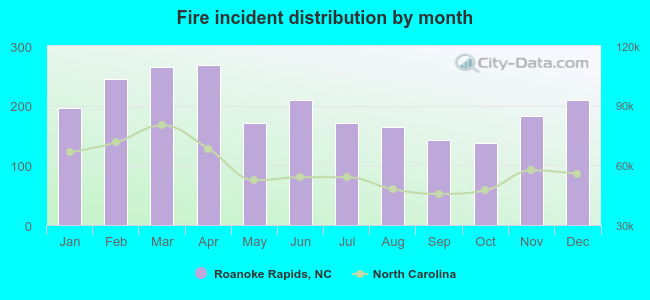 According to the 2,363 reports from years 2002 - 2018 most fires (11.3%) took place during April, and the least (5.8%) in October.
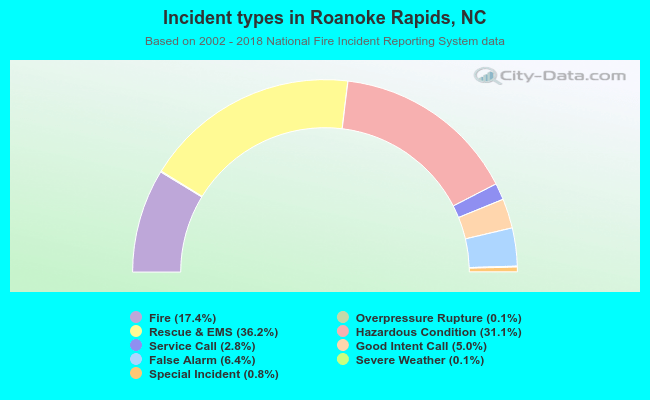 Out of all 13,546 cases reported during the years 2002 - 2018, the most belonged to the categories: Rescue & EMS (36.2%), Hazardous Condition (31.1%), and Fire (17.4%).
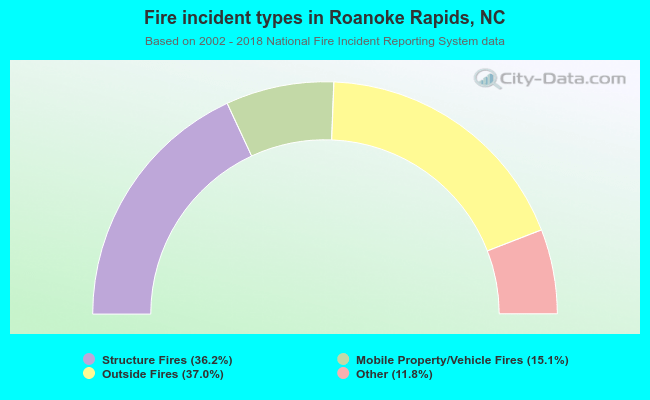 When looking into fire subcategories, the most reports belonged to: Outside Fires (37.0%), and Structure Fires (36.2%).