Ponchatoula: Fire Incidents, Louisiana (LA)
Where are fire incidents reported in Ponchatoula, LA
Something went wrong! Please refresh the page.
|
| |||||||||||||||||||||||||||||||||||||||||||||||||||||||||||||||||||||||||||||||||||||||||||||||||||||||||||||
2002 - 2018 National Fire Incident Reporting System (NFIRS) incidents
- Incident types reported to NFIRS in Ponchatoula, LA
- 2,44545.2%Rescue & EMS
- 1,44426.7%Fire
- 56310.4%False Alarm
- 5299.8%Hazardous Condition
- 3276.0%Good Intent Call
- 831.5%Service Call
- 90.2%Severe Weather
- Fire incident types reported to NFIRS in Ponchatoula, LA
- 69848.3%Outside Fires
- 44430.7%Structure Fires
- 25017.3%Mobile Property/Vehicle Fires
- 523.6%Other
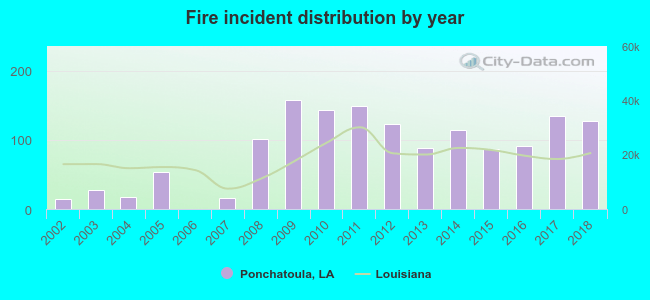 Based on the data from the years 2002 - 2018 the average number of fires per year is 85. The highest number of fire incidents - 157 took place in 2009, and the least - 0 in 2006. The data has a rising trend.
The average number of yearly fire incidents per 10k residents in Ponchatoula, LA compared to nearest cities:
(Note: Based on data for the last 3 years, including only cities with population 5,000 and above)
| Ponchatoula: | 170.4 |
| Hammond: | 135.4 |
| Covington: | 252.3 |
| Mandeville: | 120.4 |
| Walker: | 191.8 |
| Laplace: | 38.1 |
| Reserve: | 54.6 |
| Denham Springs: | 383.0 |
| Lacombe: | 89.9 |
 The median response time based on all reported fire incidents is 6 minutes. This is similar to the state median value.
The median response time in Ponchatoula, LA compared to nearest cities:
(Note: Based on data for all years, including only cities with at least 500 fire incidents)
| Ponchatoula: | 6 minutes |
| Hammond: | 6 minutes |
| Albany: | 9 minutes |
| Tickfaw: | 6 minutes |
| Independence: | 6 minutes |
| Madisonville: | 7 minutes |
| Livingston: | 9 minutes |
| Folsom: | 7 minutes |
| Covington: | 6 minutes |
 Based on the data from the years 2002 - 2018 the average number of fire-related yearly deaths is 0. The highest number of reported deaths - 2 took place in 2009, and the lowest - 0 in 2002. The data has a constant trend.
 33.0% incidents where reported in the morning and 67.0% in the evening. The most fires (15.8%) took place on Saturday, and the least (13.4%) on Thursday.
 According to the 1,444 fire incident reports from years 2002 - 2018 most fires (10.9%) took place during January, and the least (6.2%) in August.
 Out of all 5,409 cases reported during the years 2002 - 2018, the most belonged to the categories: Rescue & EMS (45.2%), Fire (26.7%), and False Alarm (10.4%).
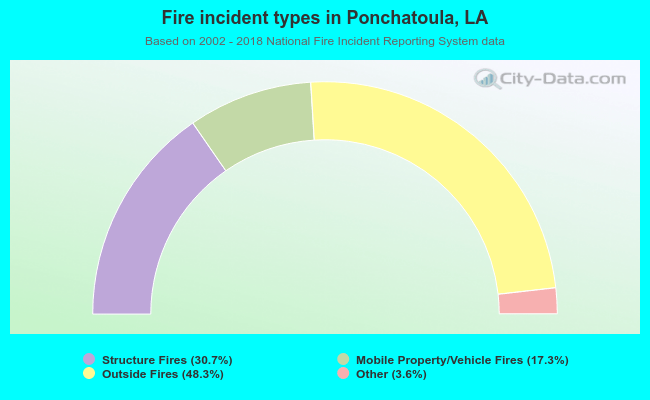 When looking into fire subcategories, the most reports belonged to: Outside Fires (48.3%), and Structure Fires (30.7%).