Point Pleasant: Fire Incidents, New Jersey (NJ)
Where are fire incidents reported in Point Pleasant, NJ
Something went wrong! Please refresh the page.
|
| |||||||||||||||||||||||||||||||||||||||||||||||||||||||||||||||||||||||||||||||||||||||||||||||||||||||||||||
2004 - 2018 National Fire Incident Reporting System (NFIRS) incidents
- Incident types reported to NFIRS in Point Pleasant, NJ
- 60050.9%Hazardous Condition
- 27223.1%Fire
- 18415.6%False Alarm
- 705.9%Good Intent Call
- 312.6%Service Call
- 211.8%Rescue & EMS
- Fire incident types reported to NFIRS in Point Pleasant, NJ
- 10739.3%Structure Fires
- 9936.4%Outside Fires
- 3512.9%Other
- 3111.4%Mobile Property/Vehicle Fires
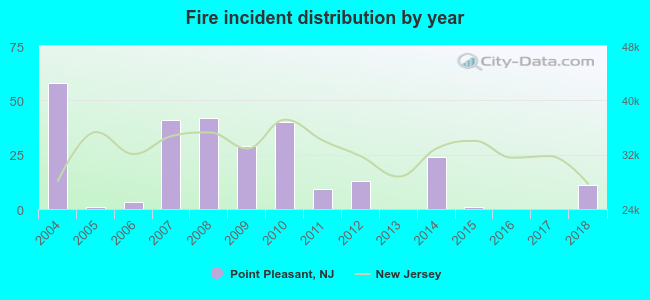 According to the data from the years 2004 - 2018 the average number of fires per year is 18. The highest number of fires - 58 took place in 2004, and the least - 0 in 2013. The data has a decreasing trend.
The average number of yearly fire incidents per 10k residents in Point Pleasant, NJ compared to nearest cities:
(Note: Based on data for the last 3 years, including only cities with population 5,000 and above)
| Point Pleasant: | 5.9 |
| Manasquan: | 64.2 |
| Belmar: | 23.9 |
| Lakewood: | 1.7 |
| Toms River: | 21.6 |
| Asbury Park: | 53.2 |
| Beachwood: | 36.7 |
| Tinton Falls: | 47.9 |
| Eatontown: | 35.6 |

 27.2% incidents where reported in the morning and 72.8% in the evening. The most fires (17.6%) took place on Saturday, and the least (10.7%) on Wednesday.
 According to the 272 fire incidents from years 2004 - 2018 most fires (13.2%) took place during March, and the least (4.8%) in December.
 Out of all 1,178 cases reported during the years 2004 - 2018, the most belonged to the categories: Rescue & EMS (50.9%), Fire (23.1%), and Good Intent Call (15.6%).
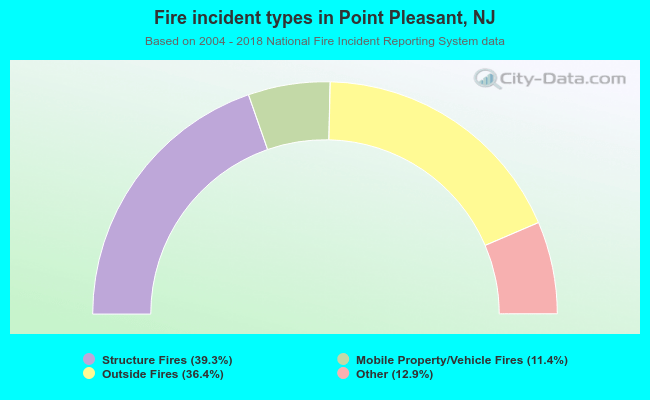 When looking into fire subcategories, the most reports belonged to: Structure Fires (39.3%), and Outside Fires (36.4%).