Plainfield: Fire Incidents, New Jersey (NJ)
Where are fire incidents reported in Plainfield, NJ
Something went wrong! Please refresh the page.
| Fire incidents reported | |
|---|---|
| Sreet name | Count |
| CENTRAL AVENUE | 342 |
| CENTRAL AVE | 74 |
| WEST FRONT ST | 64 |
| EAST FRONT ST | 48 |
| FRONT ST | 48 |
| WEST 7TH ST | 42 |
| SOUTH AV | 36 |
| WEST 3RD ST | 36 |
| PARK AV | 34 |
| EAST 2ND ST | 32 |
| 7TH ST | 28 |
| ARLINGTON AV | 28 |
| CLINTON AV | 28 |
| EAST 7TH ST | 28 |
| WEST 4TH ST | 28 |
| EAST FRONT STREET | 26 |
| CENTRAL AV | 24 |
| SECOND ST | 24 |
| SOUTH 2ND ST | 22 |
| WEST FRONT STREET | 22 |
| 2ND ST | 20 |
| ARLINGTON AVE | 20 |
| NORTH AVE | 20 |
| PARK AVENUE | 20 |
| 3RD ST | 16 |
| EAST 7TH STREET | 16 |
| LELAND AV | 16 |
| MYRTLE AV | 16 |
| PARK AVE | 16 |
| SOUTH AVE | 16 |
| Other | 303 |
2004 - 2018 National Fire Incident Reporting System (NFIRS) incidents
- Incident types reported to NFIRS in Plainfield, NJ
- 3,02829.8%Hazardous Condition
- 2,53825.0%False Alarm
- 1,98519.5%Service Call
- 1,49314.7%Fire
- 6436.3%Rescue & EMS
- 4224.2%Good Intent Call
- 310.3%Special Incident
- 170.2%Severe Weather
- 110.1%Overpressure Rupture
- Fire incident types reported to NFIRS in Plainfield, NJ
- 1,01167.7%Structure Fires
- 28018.8%Outside Fires
- 1167.8%Mobile Property/Vehicle Fires
- 865.8%Other
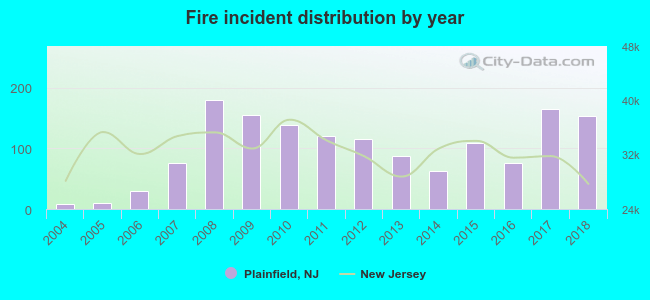 According to the data from the years 2004 - 2018 the average number of fire incidents per year is 99. The highest number of fires - 179 took place in 2008, and the least - 9 in 2004. The data has a growing trend.
The average number of yearly fire incidents per 10k residents in Plainfield, NJ compared to nearest cities:
(Note: Based on data for the last 3 years, including only cities with population 5,000 and above)
| Plainfield: | 25.8 |
| North Plainfield: | 21.8 |
| Watchung: | 19.9 |
| South Plainfield: | 48.3 |
| Fanwood: | 9.6 |
| Scotch Plains: | 31.4 |
| Dunellen: | 9.0 |
| Berkeley Heights: | 30.8 |
| Westfield: | 18.3 |
 The median response time based on all reported fire incidents is 5 minutes. This is similar to the state median value.
The median response time in Plainfield, NJ compared to nearest cities:
(Note: Based on data for all years, including only cities with at least 500 fire incidents)
| Plainfield: | 5 minutes |
| North Plainfield: | 5 minutes |
| South Plainfield: | 4 minutes |
| Scotch Plains: | 6 minutes |
| Berkeley Heights: | 5 minutes |
| Westfield: | 3 minutes |
| Colonia: | 5 minutes |
| Clark: | 6 minutes |
| Iselin: | 5 minutes |
 According to the reports from the years 2004 - 2018 the average number of fire-related casualties per year is 2. The highest number of reported casualties - 10 took place in 2008, and the lowest - 0 in 2004. The data has a rising trend.
The average number of injuries per 1,000 fires is 11. This indicator was the highest - 58 in 2018, and the lowest 0 in 2004. The trend for injuries per 1,000 fires is rising. Compared to the New Jersey value the number of injuries per 1,000 fires is higher.
According to the reports from the years 2004 - 2018 the average number of fire-related casualties per year is 2. The highest number of reported casualties - 10 took place in 2008, and the lowest - 0 in 2004. The data has a rising trend.
The average number of injuries per 1,000 fires is 11. This indicator was the highest - 58 in 2018, and the lowest 0 in 2004. The trend for injuries per 1,000 fires is rising. Compared to the New Jersey value the number of injuries per 1,000 fires is higher.Casualties per 1,000 incidents in Plainfield, NJ compared to nearest cities:
(Note: Based on data for all years, including only cities with at least 500 fire incidents)
| Plainfield: | 16.7 |
| North Plainfield: | 31.9 |
| South Plainfield: | 21.8 |
| Scotch Plains: | 4.8 |
| Berkeley Heights: | 19.2 |
| Westfield: | 9.8 |
| Colonia: | 5.7 |
| Clark: | 14.5 |
| Iselin: | 5.1 |
 36.0% incidents where reported in the morning and 64.0% in the evening. The most fires (16.9%) took place on Saturday, and the least (12.3%) on Wednesday.
 Based on the 1,493 fire incidents from years 2004 - 2018 most fires (11.3%) took place during April, and the least (6.2%) in May.
 Out of all 10,168 cases reported during the years 2004 - 2018, the most belonged to the categories: Hazardous Condition (29.8%), False Alarm (25.0%), and Service Call (19.5%).
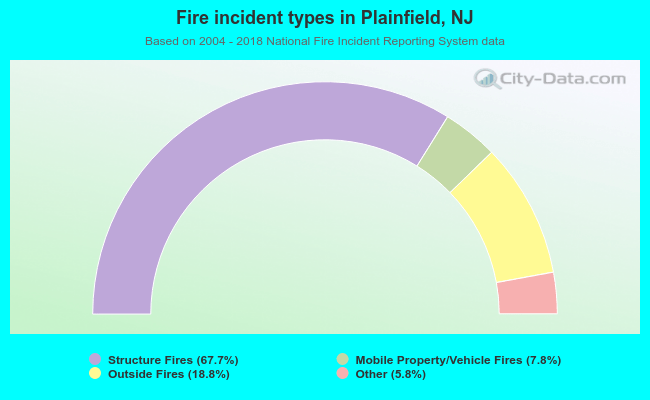 When looking into fire subcategories, the most incidents belonged to: Structure Fires (67.7%), and Outside Fires (18.8%).