Parma Heights: Fire Incidents, Ohio (OH)
Where are fire incidents reported in Parma Heights, OH
Something went wrong! Please refresh the page.
| Fire incidents reported | |
|---|---|
| Sreet name | Count |
| PEARL RD | 262 |
| YORK RD | 170 |
| INDEPENDENCE BLVD | 136 |
| STUMPH RD | 74 |
| 130TH ST | 68 |
| NORTH CHURCH DR | 62 |
| BIG CREEK PKY | 58 |
| CHURCH DR | 48 |
| CHEYENNE TRL | 36 |
| RIDGEWOOD DR | 36 |
| APACHE DR | 30 |
| BERESFORD AVE | 28 |
| BRANDYWINE RD | 24 |
| HUFFMAN RD | 24 |
| VALLEY FORGE DR | 24 |
| OLDE YORK RD | 20 |
| PARMA PARK BLVD | 20 |
| STRATFORD DR | 20 |
| ANTHONY LANE | 18 |
| EDGEHILL DR | 18 |
| SNOW RD | 16 |
| ANITA DR | 14 |
| BARRINGTON BLVD | 14 |
| CREEKHAVEN DR | 14 |
| DENISON BLVD | 14 |
| MEADOWBROOK DR | 14 |
| GREENLEAF AVE | 12 |
| LYNNHAVEN RD | 12 |
| MANORFORD DR | 12 |
| ORCHARD BLVD | 12 |
2002 - 2018 National Fire Incident Reporting System (NFIRS) incidents
- Incident types reported to NFIRS in Parma Heights, OH
- 15,62075.2%Rescue & EMS
- 1,9869.6%Hazardous Condition
- 9694.7%Fire
- 8554.1%False Alarm
- 8534.1%Service Call
- 4051.9%Good Intent Call
- 460.2%Overpressure Rupture
- 430.2%Special Incident
- Fire incident types reported to NFIRS in Parma Heights, OH
- 62164.1%Structure Fires
- 24525.3%Outside Fires
- 737.5%Mobile Property/Vehicle Fires
- 303.1%Other
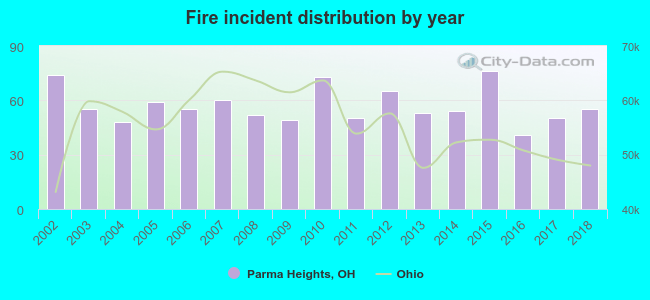 Based on the data from the years 2002 - 2018 the average number of fire incidents per year is 57. The highest number of reported fires - 76 took place in 2015, and the least - 41 in 2016. The data has a dropping trend.
The average number of yearly fire incidents per 10k residents in Parma Heights, OH compared to nearest cities:
(Note: Based on data for the last 3 years, including only cities with population 5,000 and above)
| Parma Heights: | 23.9 |
| Parma: | 21.2 |
| Middleburg Heights: | 26.2 |
| Brook Park: | 25.1 |
| Brooklyn: | 42.3 |
| North Royalton: | 19.5 |
| Seven Hills: | 23.6 |
| Berea: | 43.9 |
| Strongsville: | 22.2 |
 The median response time based on all reported fire incidents is 3 minutes. This is much lower compared to the Ohio median value.
The median response time in Parma Heights, OH compared to nearest cities:
(Note: Based on data for all years, including only cities with at least 500 fire incidents)
| Parma Heights: | 3 minutes |
| Parma: | 4 minutes |
| Brook Park: | 5 minutes |
| Brooklyn: | 4 minutes |
| North Royalton: | 5 minutes |
| Berea: | 5 minutes |
| Strongsville: | 6 minutes |
| Fairview Park: | 5 minutes |
| Independence: | 6 minutes |
 Based on the reports from the years 2002 - 2018 the average number of fire-related yearly deaths is 0. The highest number of reported deaths - 2 took place in 2010, and the lowest - 0 in 2002. The data has a constant trend.
 Based on the reports from the years 2002 - 2018 the average number of fire-related casualties per year is 2. The highest number of casualties - 7 took place in 2011, and the lowest - 0 in 2013. The data has a rising trend.
The average number of casualties per 1,000 fires is 44. This indicator was the highest - 140 in 2011, and the lowest 0 in 2013. The trend for injuries per 1,000 fire incidents is increasing. Compared to the state value the number of casualties per 1,000 fires is much higher.
Based on the reports from the years 2002 - 2018 the average number of fire-related casualties per year is 2. The highest number of casualties - 7 took place in 2011, and the lowest - 0 in 2013. The data has a rising trend.
The average number of casualties per 1,000 fires is 44. This indicator was the highest - 140 in 2011, and the lowest 0 in 2013. The trend for injuries per 1,000 fire incidents is increasing. Compared to the state value the number of casualties per 1,000 fires is much higher.Casualties per 1,000 incidents in Parma Heights, OH compared to nearest cities:
(Note: Based on data for all years, including only cities with at least 500 fire incidents)
| Parma Heights: | 43.3 |
| Parma: | 19.1 |
| Brook Park: | 25.0 |
| Brooklyn: | 6.3 |
| North Royalton: | 11.0 |
| Berea: | 15.4 |
| Strongsville: | 9.1 |
| Fairview Park: | 7.1 |
| Independence: | 8.2 |
 27.9% incidents where reported in the morning and 72.1% in the evening. The most fires (16.8%) took place on Sunday, and the least (11.8%) on Thursday.
 Based on the 969 incident reports from years 2002 - 2018 most fires (12.1%) took place during July, and the least (6.1%) in September.
 Out of all 20,781 cases reported during the years 2002 - 2018, the most belonged to the categories: Rescue & EMS (75.2%), Hazardous Condition (9.6%), and Fire (4.7%).
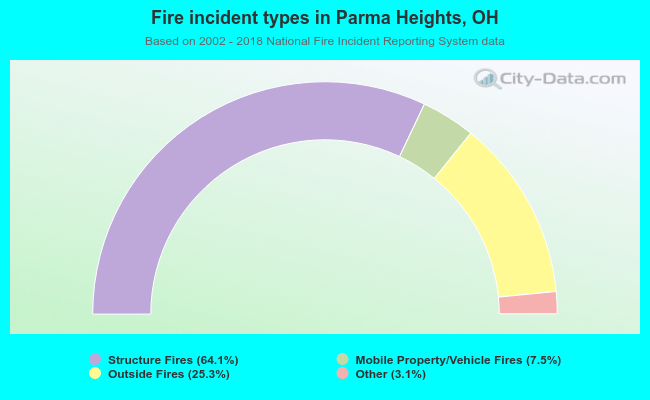 When looking into fire subcategories, the most incidents belonged to: Structure Fires (64.1%), and Outside Fires (25.3%).