Pacifica: Fire Incidents, California (CA)
Where are fire incidents reported in Pacifica, CA
Something went wrong! Please refresh the page.
| Fire incidents reported | |
|---|---|
| Sreet name | Count |
| CABRILLO HWY | 132 |
| CRESPI DR | 88 |
| TERRA NOVA BLVD | 58 |
| BEACH BLVD | 48 |
| GATEWAY DR | 48 |
| PALMETTO AV | 48 |
| MANOR DR | 46 |
| ESPLANADE AV | 44 |
| ODDSTAD BLVD | 42 |
| ROSITA RD | 42 |
| OCEANA BLVD | 40 |
| IMPERIAL DR | 36 |
| PALMETTO AVE | 34 |
| LINDA MAR BLVD | 32 |
| SHARP PARK RD | 32 |
| PALOMA AV | 30 |
| CLARIDGE DR | 28 |
| HICKEY BLVD | 28 |
| BEAUMONT BLVD | 26 |
| FASSLER | 26 |
| HEATHCLIFF DR | 26 |
| EASTRIDGE CIR | 24 |
| FRANCISCO BLVD | 24 |
| INVERNESS DR | 22 |
| MORIS POINT RD | 22 |
| TALBOT AV | 22 |
| ADOBE DR | 20 |
| LINDA MAR SHOPPING CTR | 20 |
| PALMETTO | 20 |
| GRAND TETON DR | 18 |
| Other | 219 |
2005 - 2018 National Fire Incident Reporting System (NFIRS) incidents
- Incident types reported to NFIRS in Pacifica, CA
- 7,34649.1%Rescue & EMS
- 2,23514.9%Hazardous Condition
- 1,82112.2%Good Intent Call
- 1,51710.1%Service Call
- 1,3459.0%Fire
- 6404.3%False Alarm
- 320.2%Severe Weather
- 210.1%Overpressure Rupture
- Fire incident types reported to NFIRS in Pacifica, CA
- 68851.2%Structure Fires
- 44533.1%Outside Fires
- 1239.1%Mobile Property/Vehicle Fires
- 896.6%Other
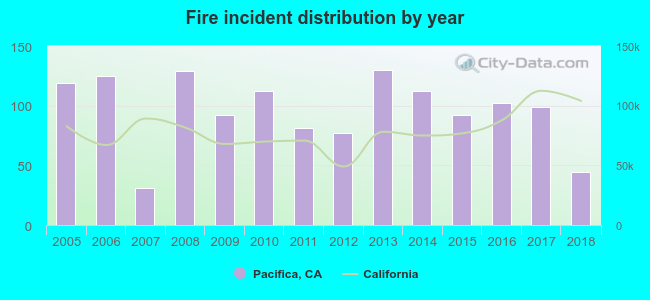 According to the data from the years 2005 - 2018 the average number of fires per year is 96. The highest number of fire incidents - 130 took place in 2013, and the least - 31 in 2007. The data has a decreasing trend.
The average number of yearly fire incidents per 10k residents in Pacifica, CA compared to nearest cities:
(Note: Based on data for the last 3 years, including only cities with population 5,000 and above)
| Pacifica: | 20.9 |
| San Bruno: | 22.9 |
| South San Francisco: | 19.8 |
| Daly City: | 14.1 |
| Millbrae: | 25.4 |
| Burlingame: | 17.3 |
| El Granada: | 4.9 |
| Hillsborough: | 12.6 |
| San Francisco: | 36.6 |
 The median response time based on all reported fire incidents is 5 minutes. This is lower compared to the state median value.
The median response time in Pacifica, CA compared to nearest cities:
(Note: Based on data for all years, including only cities with at least 500 fire incidents)
| Pacifica: | 5 minutes |
| San Bruno: | 4 minutes |
| South San Francisco: | 4 minutes |
| Daly City: | 4 minutes |
| Millbrae: | 4 minutes |
| Brisbane: | 5 minutes |
| Burlingame: | 4 minutes |
| San Francisco: | 4 minutes |
| San Mateo: | 4 minutes |
 Based on the reports from the years 2005 - 2018 the average number of fire-related casualties per year is 1. The highest number of reported casualties - 2 took place in 2005, and the lowest - 0 in 2007. The data has a declining trend.
The average number of casualties per 1,000 fire incidents is 5. This indicator was the highest - 17 in 2005, and the lowest 0 in 2007. The trend for injuries per 1,000 fires is dropping. Compared to the California value the number of injuries per 1,000 fire incidents is about the same.
Based on the reports from the years 2005 - 2018 the average number of fire-related casualties per year is 1. The highest number of reported casualties - 2 took place in 2005, and the lowest - 0 in 2007. The data has a declining trend.
The average number of casualties per 1,000 fire incidents is 5. This indicator was the highest - 17 in 2005, and the lowest 0 in 2007. The trend for injuries per 1,000 fires is dropping. Compared to the California value the number of injuries per 1,000 fire incidents is about the same.Casualties per 1,000 incidents in Pacifica, CA compared to nearest cities:
(Note: Based on data for all years, including only cities with at least 500 fire incidents)
| Pacifica: | 5.2 |
| San Bruno: | 6.8 |
| South San Francisco: | 7.0 |
| Daly City: | 5.2 |
| Millbrae: | 2.1 |
| Brisbane: | 2.9 |
| Burlingame: | 4.7 |
| San Francisco: | 5.9 |
| San Mateo: | 0.7 |
 33.1% incidents where reported in the morning and 66.9% in the evening. The most fires (17.5%) took place on Sunday, and the least (12.4%) on Thursday.
 Based on the 1,345 fires from years 2005 - 2018 most fires (12.6%) took place during July, and the least (5.9%) in March.
 Out of all 14,970 cases reported during the years 2005 - 2018, the most belonged to the categories: Rescue & EMS (49.1%), Hazardous Condition (14.9%), and Good Intent Call (12.2%).
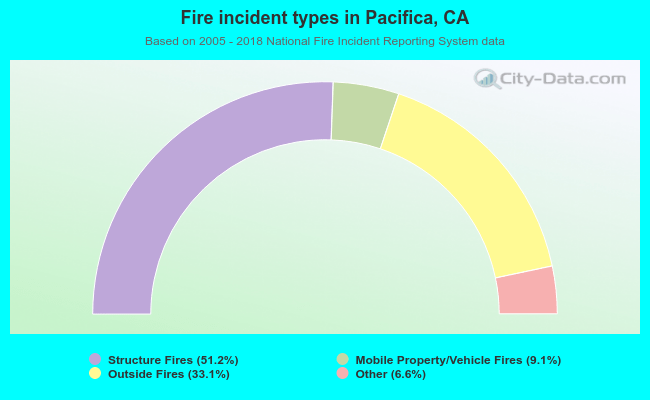 When looking into fire subcategories, the most incidents belonged to: Structure Fires (51.2%), and Outside Fires (33.1%).