Oconomowoc: Fire Incidents, Wisconsin (WI)
Where are fire incidents reported in Oconomowoc, WI
Something went wrong! Please refresh the page.
| Fire incidents reported | |
|---|---|
| Sreet name | Count |
| WISCONSIN AVE | 146 |
| MAIN ST | 72 |
| SUMMIT AVE | 66 |
| VALLEY RD | 58 |
| CONCORD RD | 48 |
| ARMOUR RD | 36 |
| GENESEE LAKE RD | 36 |
| BOLSON DR | 30 |
| BROWN ST | 30 |
| DOUSMAN RD | 30 |
| LAKE DR | 26 |
| SILVER LAKE ST | 26 |
| WASHINGTON ST | 26 |
| BARTLETT RD | 24 |
| LANG RD | 24 |
| MAPLETON RD | 24 |
| DELAFIELD RD | 22 |
| SUNSET DR | 22 |
| WORTHINGTON ST | 22 |
| HARTWELL PL | 20 |
| LAKE RD | 20 |
| MORGAN RD | 20 |
| SUTHERLAND CIR | 20 |
| FOWLER ST | 18 |
| K HWY | 18 |
| NORTH POLE LN | 18 |
| VENICE PARK RD | 18 |
| WATERVILLE RD | 18 |
| 212 CONCORD AVE | 16 |
| 94 INT | 16 |
| Other | 520 |
2003 - 2018 National Fire Incident Reporting System (NFIRS) incidents
- Incident types reported to NFIRS in Oconomowoc, WI
- 11,02370.5%Rescue & EMS
- 1,4909.5%Fire
- 1,3198.4%Hazardous Condition
- 7604.9%False Alarm
- 6994.5%Good Intent Call
- 3282.1%Service Call
- Fire incident types reported to NFIRS in Oconomowoc, WI
- 93462.7%Structure Fires
- 36224.3%Outside Fires
- 1298.7%Mobile Property/Vehicle Fires
- 654.4%Other
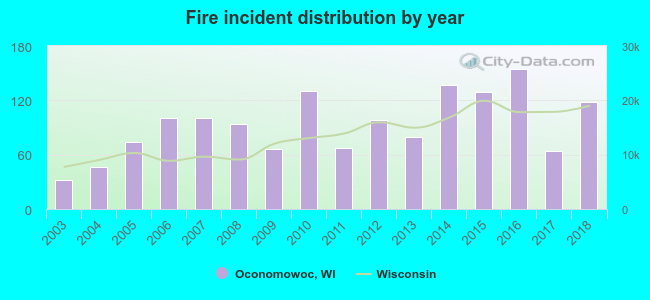 Based on the data from the years 2003 - 2018 the average number of fire incidents per year is 93. The highest number of reported fire incidents - 155 took place in 2016, and the least - 32 in 2003. The data has a rising trend.
The average number of yearly fire incidents per 10k residents in Oconomowoc, WI compared to nearest cities:
(Note: Based on data for the last 3 years, including only cities with population 5,000 and above)
| Oconomowoc: | 68.8 |
| Delafield: | 49.3 |
| Hartland: | 55.8 |
| Genesee: | 1.8 |
| Watertown: | 33.9 |
| Pewaukee: | 40.9 |
| Lisbon: | 3.0 |
| Sussex: | 23.0 |
| Waukesha: | 23.6 |
 The median response time based on all reported fire incidents is 10 minutes. This is higher than the state median value.
The median response time in Oconomowoc, WI compared to nearest cities:
(Note: Based on data for all years, including only cities with at least 500 fire incidents)
| Oconomowoc: | 10 minutes |
| Hartland: | 9 minutes |
| Watertown: | 7 minutes |
| Pewaukee: | 8 minutes |
| Sussex: | 9 minutes |
| Waukesha: | 6 minutes |
| Hartford: | 8 minutes |
| Brookfield: | 7 minutes |
| Menomonee Falls: | 6 minutes |
 According to the data from the years 2003 - 2018 the average number of fire-related casualties per year is 0. The highest number of injuries - 3 took place in 2012, and the lowest - 0 in 2003. The data has a constant trend.
The average number of casualties per 1,000 fires is 4. This indicator was the highest - 31 in 2012, and the lowest 0 in 2003. The trend for injuries per 1,000 fires is constant. Compared to the state value the number of injuries per 1,000 incidents is much lower.
According to the data from the years 2003 - 2018 the average number of fire-related casualties per year is 0. The highest number of injuries - 3 took place in 2012, and the lowest - 0 in 2003. The data has a constant trend.
The average number of casualties per 1,000 fires is 4. This indicator was the highest - 31 in 2012, and the lowest 0 in 2003. The trend for injuries per 1,000 fires is constant. Compared to the state value the number of injuries per 1,000 incidents is much lower.Casualties per 1,000 incidents in Oconomowoc, WI compared to nearest cities:
(Note: Based on data for all years, including only cities with at least 500 fire incidents)
| Oconomowoc: | 4.0 |
| Hartland: | 3.8 |
| Watertown: | 18.5 |
| Pewaukee: | 16.7 |
| Sussex: | 10.1 |
| Waukesha: | 11.9 |
| Hartford: | 15.0 |
| Brookfield: | 21.0 |
| Menomonee Falls: | 15.4 |
 32.8% incidents where reported in the morning and 67.2% in the evening. The most fires (17.3%) took place on Friday, and the least (12.3%) on Wednesday.
 According to the 1,490 fires from years 2003 - 2018 most fires (12.4%) took place during April, and the least (6.0%) in January.
 Out of all 15,643 cases reported during the years 2003 - 2018, the most belonged to the categories: Rescue & EMS (70.5%), Fire (9.5%), and Hazardous Condition (8.4%).
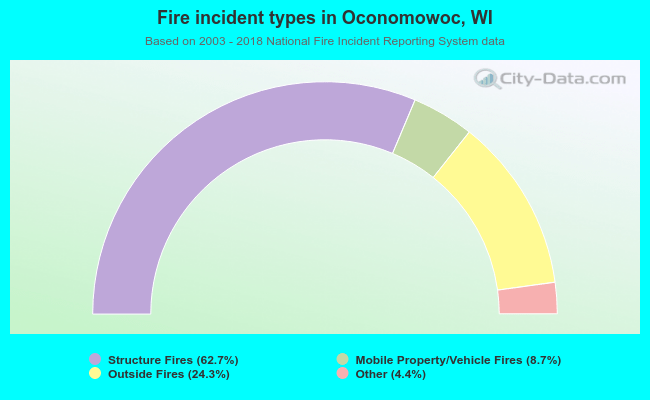 When looking into fire subcategories, the most reports belonged to: Structure Fires (62.7%), and Outside Fires (24.3%).