Oak Forest: Fire Incidents, Illinois (IL)
Where are fire incidents reported in Oak Forest, IL
Something went wrong! Please refresh the page.
| Fire incidents reported | |
|---|---|
| Sreet name | Count |
| 159TH ST | 258 |
| CICERO AVE | 156 |
| CENTRAL AVE | 134 |
| LECLAIRE AVE | 118 |
| LARAMIE AVE | 104 |
| 167TH ST | 82 |
| I-57 SOUTH BOUND EXPY | 50 |
| 151ST ST | 48 |
| WAVERLY AVE | 46 |
| 157TH ST | 44 |
| LAMON AVE | 44 |
| TERRACE DR | 44 |
| I-57 NORTH BOUND EXPY | 40 |
| FOREST AVE | 38 |
| LOCKWOOD AVE | 38 |
| LE CLAIRE AVE | 36 |
| PEGGY LN | 36 |
| I 57 NB MM 346 167TH ST | 34 |
| VICTORIA DR | 34 |
| KILPATRICK AVE | 32 |
| LAURA LN | 32 |
| LONG AVE | 32 |
| 149TH ST | 30 |
| ROB ROY DR | 30 |
| 147TH ST | 28 |
| 152ND ST | 28 |
| LOREL AVE | 26 |
| HENRY ST | 24 |
| JAMES | 24 |
| RIDGELAND AVE | 24 |
| Other | 162 |
2002 - 2018 National Fire Incident Reporting System (NFIRS) incidents
- Incident types reported to NFIRS in Oak Forest, IL
- 12,33861.0%Rescue & EMS
- 1,8839.3%Hazardous Condition
- 1,8569.2%Fire
- 1,6198.0%False Alarm
- 1,2876.4%Service Call
- 1,1905.9%Good Intent Call
- 420.2%Overpressure Rupture
- Fire incident types reported to NFIRS in Oak Forest, IL
- 96251.8%Structure Fires
- 57631.0%Outside Fires
- 29916.1%Mobile Property/Vehicle Fires
- 191.0%Other
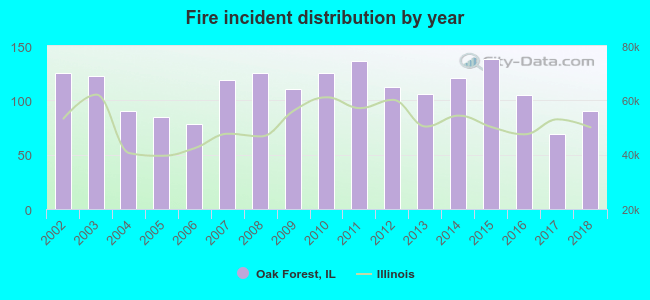 Based on the data from the years 2002 - 2018 the average number of fire incidents per year is 109. The highest number of fire incidents - 138 took place in 2015, and the least - 69 in 2017. The data has a declining trend.
The average number of yearly fire incidents per 10k residents in Oak Forest, IL compared to nearest cities:
(Note: Based on data for the last 3 years, including only cities with population 5,000 and above)
| Oak Forest: | 31.2 |
| Midlothian: | 59.0 |
| Crestwood: | 51.7 |
| Markham: | 111.1 |
| Robbins: | 109.5 |
| Country Club Hills: | 63.0 |
| Tinley Park: | 26.4 |
| Posen: | 48.7 |
| Hazel Crest: | 57.3 |
 The median response time based on all reported fire incidents is 5 minutes. This is comparable to the Illinois median value.
The median response time in Oak Forest, IL compared to nearest cities:
(Note: Based on data for all years, including only cities with at least 500 fire incidents)
| Oak Forest: | 5 minutes |
| Midlothian: | 4 minutes |
| Crestwood: | 4 minutes |
| Markham: | 5 minutes |
| Robbins: | 6 minutes |
| Country Club Hills: | 5 minutes |
| Tinley Park: | 6 minutes |
| Posen: | 4 minutes |
| Hazel Crest: | 5 minutes |
 According to the data from the years 2002 - 2018 the average number of fire-related casualties per year is 1. The highest number of reported casualties - 7 took place in 2006, and the lowest - 0 in 2011. The data has a declining trend.
The average number of casualties per 1,000 fires is 13. This indicator was the highest - 90 in 2006, and the lowest 0 in 2011. The trend for casualties per 1,000 fire incidents is decreasing. Compared to the state value the number of injuries per 1,000 fires is about the same.
According to the data from the years 2002 - 2018 the average number of fire-related casualties per year is 1. The highest number of reported casualties - 7 took place in 2006, and the lowest - 0 in 2011. The data has a declining trend.
The average number of casualties per 1,000 fires is 13. This indicator was the highest - 90 in 2006, and the lowest 0 in 2011. The trend for casualties per 1,000 fire incidents is decreasing. Compared to the state value the number of injuries per 1,000 fires is about the same.Casualties per 1,000 incidents in Oak Forest, IL compared to nearest cities:
(Note: Based on data for all years, including only cities with at least 500 fire incidents)
| Oak Forest: | 11.3 |
| Midlothian: | 29.2 |
| Crestwood: | 64.6 |
| Markham: | 0.0 |
| Robbins: | 5.1 |
| Country Club Hills: | 6.0 |
| Tinley Park: | 4.7 |
| Posen: | 1.5 |
| Hazel Crest: | 11.5 |
 32.5% incidents where reported in the morning and 67.5% in the evening. The most fires (17.0%) took place on Sunday, and the least (12.4%) on Monday.
 Based on the 1,856 incident reports from years 2002 - 2018 most fires (11.5%) took place during June, and the least (6.0%) in February.
 Out of all 20,235 cases reported during the years 2002 - 2018, the most belonged to the categories: Rescue & EMS (61.0%), Hazardous Condition (9.3%), and Fire (9.2%).
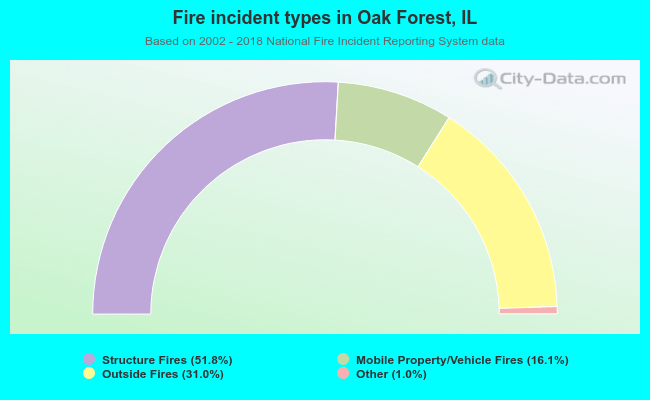 When looking into fire subcategories, the most reports belonged to: Structure Fires (51.8%), and Outside Fires (31.0%).