Nutley: Fire Incidents, New Jersey (NJ)
Where are fire incidents reported in Nutley, NJ
Something went wrong! Please refresh the page.
| Fire incidents reported | |
|---|---|
| Sreet name | Count |
| FRANKLIN AVE | 256 |
| CHESTNUT ST | 110 |
| PASSAIC AVE | 86 |
| RIVER RD | 84 |
| BLOOMFIELD AVE | 74 |
| CENTRE ST | 74 |
| HILLSIDE AVE | 54 |
| WASHINGTON AVE | 48 |
| HARRISON ST | 46 |
| KINGSLAND ST | 42 |
| HIGH ST | 34 |
| PARK AVE | 32 |
| PROSPECT ST | 30 |
| EAST CENTRE ST | 24 |
| RHODA AVE | 24 |
| WHITFORD AVE | 24 |
| GERARD RD | 20 |
| UNION AVE | 20 |
| VINCENT PL | 20 |
| HIGHFIELD LA | 18 |
| BEECH ST | 16 |
| ST MARYS PL | 16 |
| VREELAND AVE | 16 |
| WILLIAMS ST | 16 |
| CHURCH ST | 14 |
| EAST PASSAIC AVE | 14 |
| HOWARD PL | 14 |
| MOUNTAINVIEW AVE | 14 |
| ROUTE 21 NORTH | 14 |
| RUTGERS PL | 14 |
2006 - 2018 National Fire Incident Reporting System (NFIRS) incidents
- Incident types reported to NFIRS in Nutley, NJ
- 4,04738.6%Hazardous Condition
- 1,57015.0%Rescue & EMS
- 1,53814.7%Service Call
- 1,40913.4%False Alarm
- 1,12610.7%Fire
- 6916.6%Good Intent Call
- 590.6%Overpressure Rupture
- 340.3%Special Incident
- 220.2%Severe Weather
- Fire incident types reported to NFIRS in Nutley, NJ
- 73865.5%Structure Fires
- 26323.4%Outside Fires
- 1039.1%Mobile Property/Vehicle Fires
- 222.0%Other
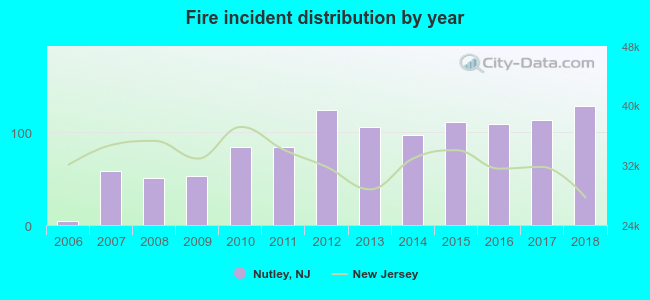 Based on the data from the years 2006 - 2018 the average number of fires per year is 86. The highest number of reported fire incidents - 129 took place in 2018, and the least - 4 in 2006. The data has a rising trend.
The average number of yearly fire incidents per 10k residents in Nutley, NJ compared to nearest cities:
(Note: Based on data for the last 3 years, including only cities with population 5,000 and above)
| Nutley: | 44.0 |
| Belleville: | 25.0 |
| Bloomfield: | 31.3 |
| Lyndhurst: | 39.0 |
| North Arlington: | 24.8 |
| Rutherford: | 45.3 |
| Glen Ridge: | 15.6 |
| Montclair: | 14.4 |
| Upper Montclair: | 11.2 |
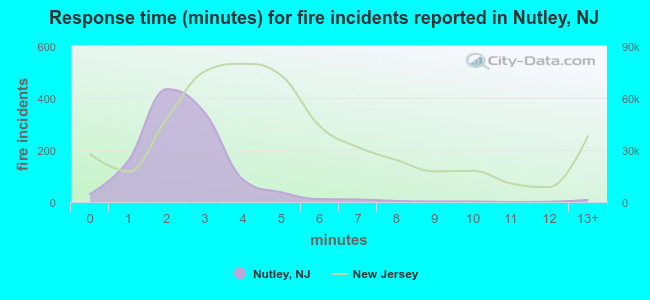 The median response time based on all reported fire incidents is 2 minutes. This is much lower compared to the state median value.
The median response time in Nutley, NJ compared to nearest cities:
(Note: Based on data for all years, including only cities with at least 500 fire incidents)
| Nutley: | 2 minutes |
| Belleville: | 3 minutes |
| Bloomfield: | 2 minutes |
| Lyndhurst: | 3 minutes |
| Rutherford: | 5 minutes |
| Montclair: | 3 minutes |
| Passaic: | 4 minutes |
| East Rutherford: | 2 minutes |
| Clifton: | 5 minutes |
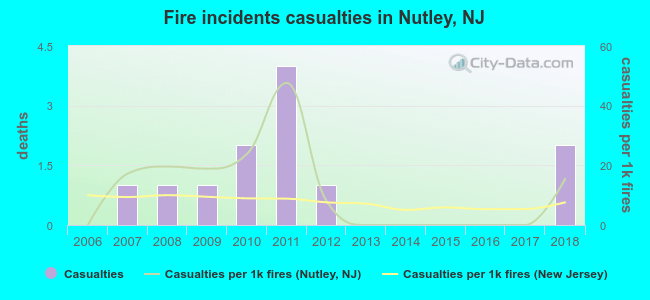 Based on the reports from the years 2006 - 2018 the average number of fire-related yearly casualties is 1. The highest number of casualties - 4 took place in 2011, and the lowest - 0 in 2006. The data has a growing trend.
The average number of injuries per 1,000 fires is 12. This indicator was the highest - 48 in 2011, and the lowest 0 in 2006. The trend for injuries per 1,000 incidents is increasing. Compared to the New Jersey value the number of injuries per 1,000 incidents is higher.
Based on the reports from the years 2006 - 2018 the average number of fire-related yearly casualties is 1. The highest number of casualties - 4 took place in 2011, and the lowest - 0 in 2006. The data has a growing trend.
The average number of injuries per 1,000 fires is 12. This indicator was the highest - 48 in 2011, and the lowest 0 in 2006. The trend for injuries per 1,000 incidents is increasing. Compared to the New Jersey value the number of injuries per 1,000 incidents is higher.Casualties per 1,000 incidents in Nutley, NJ compared to nearest cities:
(Note: Based on data for all years, including only cities with at least 500 fire incidents)
| Nutley: | 10.7 |
| Belleville: | 10.2 |
| Bloomfield: | 9.9 |
| Lyndhurst: | 6.0 |
| Rutherford: | 6.0 |
| Montclair: | 14.0 |
| Passaic: | 3.3 |
| East Rutherford: | 6.9 |
| Clifton: | 13.0 |
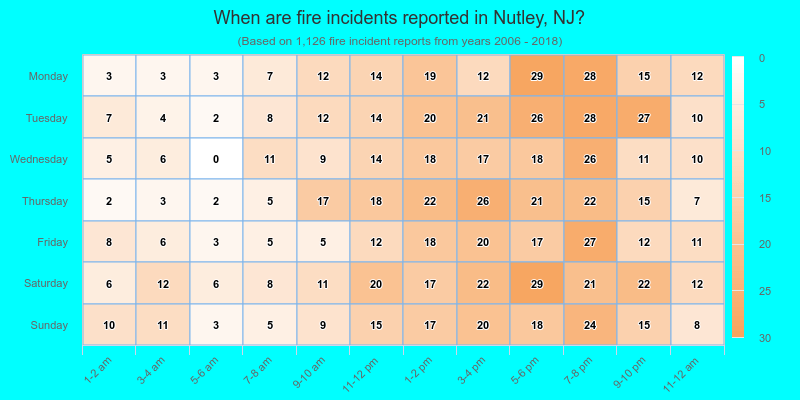
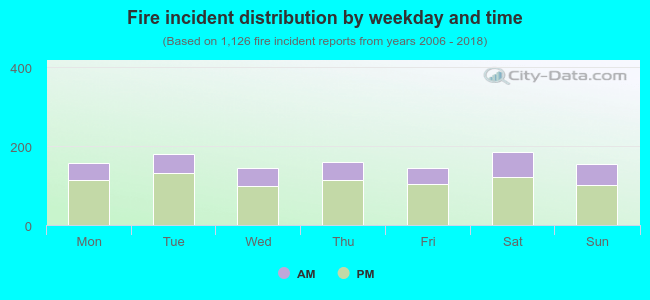 29.8% incidents where reported in the morning and 70.2% in the evening. The most fires (16.5%) took place on Saturday, and the least (12.8%) on Friday.
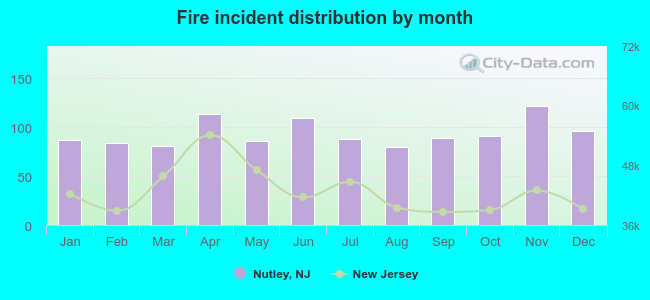 Based on the 1,126 incident reports from years 2006 - 2018 most fires (10.8%) took place during November, and the least (7.1%) in August.
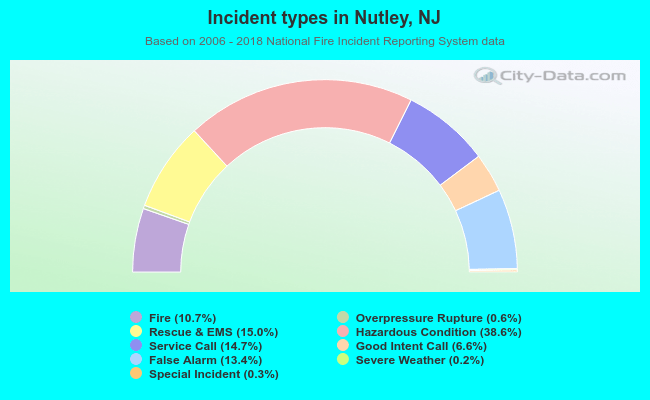 Out of all 10,496 cases reported during the years 2006 - 2018, the most belonged to the categories: Hazardous Condition (38.6%), Rescue & EMS (15.0%), and Service Call (14.7%).
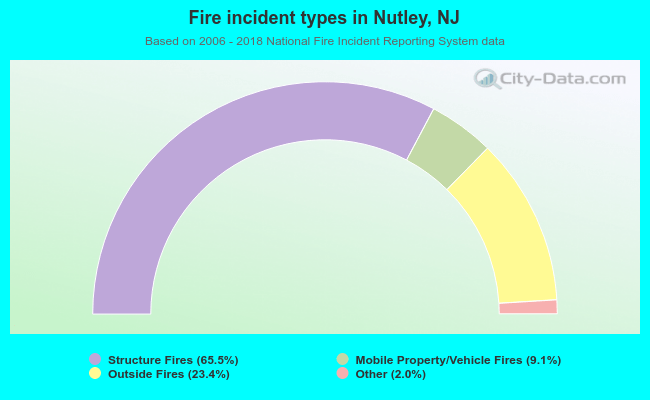 When looking into fire subcategories, the most incidents belonged to: Structure Fires (65.5%), and Outside Fires (23.4%).