Norwood: Fire Incidents, Ohio (OH)
Where are fire incidents reported in Norwood, OH
Something went wrong! Please refresh the page.
| Fire incidents reported | |
|---|---|
| Sreet name | Count |
| MONTGOMERY RD | 482 |
| MILLS AVE | 128 |
| SHERMAN AVE | 116 |
| MADISON RD | 80 |
| SECTION AVE | 80 |
| SMITH RD | 76 |
| EDMONDSON RD | 70 |
| EDWARDS RD | 68 |
| ROLSTON AVE | 62 |
| WESLEY AVE | 60 |
| ELM AVE | 58 |
| FLORAL AVE | 58 |
| CARTHAGE AVE | 56 |
| CLENEAY AVE | 56 |
| FOREST AVE | 56 |
| HIGHLAND AVE | 54 |
| LAFAYETTE AVE | 52 |
| WILLIAMS AVE | 52 |
| HARRIS AVE | 46 |
| NORWOOD AVE | 46 |
| I-71 HWY | 44 |
| 562 HWY | 42 |
| LAWN AVE | 42 |
| HUDSON AVE | 40 |
| WARREN AVE | 40 |
| HOPKINS AVE | 38 |
| HUNTER AVE | 38 |
| IVANHOE AVE | 36 |
| MAPLE AVE | 34 |
| LINCOLN AVE | 30 |
2002 - 2018 National Fire Incident Reporting System (NFIRS) incidents
- Incident types reported to NFIRS in Norwood, OH
- 4,90641.4%Rescue & EMS
- 2,01117.0%Hazardous Condition
- 1,69614.3%Fire
- 1,24810.5%False Alarm
- 1,1489.7%Service Call
- 7626.4%Good Intent Call
- 360.3%Overpressure Rupture
- 290.2%Severe Weather
- 140.1%Special Incident
- Fire incident types reported to NFIRS in Norwood, OH
- 69641.0%Outside Fires
- 67439.7%Structure Fires
- 31518.6%Mobile Property/Vehicle Fires
- 110.6%Other
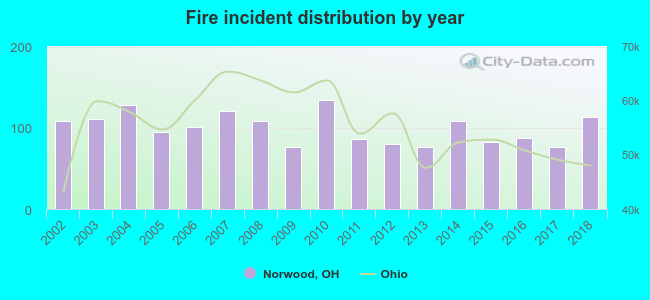 According to the data from the years 2002 - 2018 the average number of fire incidents per year is 100. The highest number of reported fire incidents - 134 took place in 2010, and the least - 76 in 2013. The data has an increasing trend.
The average number of yearly fire incidents per 10k residents in Norwood, OH compared to nearest cities:
(Note: Based on data for the last 3 years, including only cities with population 5,000 and above)
| Norwood: | 47.8 |
| Cincinnati: | 53.3 |
| Deer Park: | 26.9 |
| Reading: | 56.7 |
| Wyoming: | 21.0 |
| Madeira: | 11.9 |
| North College Hill: | 23.5 |
| Mount Healthy: | 2.7 |
| Blue Ash: | 53.8 |
 The median response time based on all reported fire incidents is 3 minutes. This is much lower than the Ohio median value.
The median response time in Norwood, OH compared to nearest cities:
(Note: Based on data for all years, including only cities with at least 500 fire incidents)
| Norwood: | 3 minutes |
| Cincinnati: | 5 minutes |
| Reading: | 5 minutes |
| Lockland: | 6 minutes |
| Wyoming: | 5 minutes |
| Newport: | 4 minutes |
| Lincoln Heights: | 5 minutes |
| Evendale: | 5 minutes |
| Woodlawn: | 5 minutes |
 According to the reports from the years 2002 - 2018 the average number of fire-related casualties per year is 1. The highest number of reported casualties - 3 took place in 2015, and the lowest - 0 in 2004. The data has a rising trend.
The average number of casualties per 1,000 fire incidents is 7. This indicator was the highest - 36 in 2015, and the lowest 0 in 2004. The trend for injuries per 1,000 fires is rising. Compared to the state value the number of casualties per 1,000 fires is much lower.
According to the reports from the years 2002 - 2018 the average number of fire-related casualties per year is 1. The highest number of reported casualties - 3 took place in 2015, and the lowest - 0 in 2004. The data has a rising trend.
The average number of casualties per 1,000 fire incidents is 7. This indicator was the highest - 36 in 2015, and the lowest 0 in 2004. The trend for injuries per 1,000 fires is rising. Compared to the state value the number of casualties per 1,000 fires is much lower.Casualties per 1,000 incidents in Norwood, OH compared to nearest cities:
(Note: Based on data for all years, including only cities with at least 500 fire incidents)
| Norwood: | 6.5 |
| Cincinnati: | 15.5 |
| Reading: | 40.6 |
| Lockland: | 11.9 |
| Wyoming: | 6.8 |
| Newport: | 20.2 |
| Lincoln Heights: | 0.0 |
| Evendale: | 3.7 |
| Woodlawn: | 3.8 |
 28.0% incidents where reported in the morning and 72.0% in the evening. The most fires (16.7%) took place on Saturday, and the least (13.0%) on Wednesday.
 Based on the 1,696 incident reports from years 2002 - 2018 most fires (10.2%) took place during September, and the least (5.8%) in February.
 Out of all 11,850 cases reported during the years 2002 - 2018, the most belonged to the categories: Rescue & EMS (41.4%), Hazardous Condition (17.0%), and Fire (14.3%).
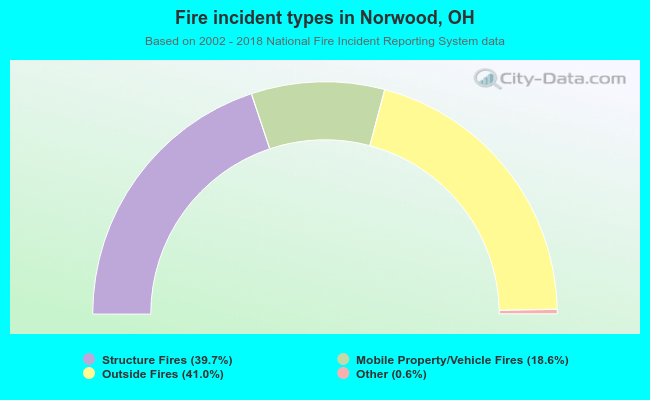 When looking into fire subcategories, the most incidents belonged to: Outside Fires (41.0%), and Structure Fires (39.7%).