Norton: Fire Incidents, Ohio (OH)
Where are fire incidents reported in Norton, OH
Something went wrong! Please refresh the page.
| Fire incidents reported | |
|---|---|
| Sreet name | Count |
| WADSWORTH RD | 118 |
| HAMETOWN RD | 88 |
| GREENWICH RD | 66 |
| BARBER RD | 56 |
| AKRON WADSWORTH RD | 44 |
| CLEVELAND - MASSILLON RD | 42 |
| SUMMIT RD | 40 |
| CLARK MILL RD | 38 |
| INTERSTATE 76 INTR | 34 |
| CLEVE MASS RD | 32 |
| JOHNSON RD | 32 |
| NORTON AVE | 30 |
| CLEVELAND MASSILLON RD | 28 |
| WOOSTER RD | 28 |
| REIMER RD | 26 |
| EASTERN RD | 24 |
| EASTON RD | 24 |
| CLARKMILL RD | 18 |
| GLENBROOK DR | 18 |
| HOUSTON RD | 18 |
| KRANCZ DR | 18 |
| OAK ST | 18 |
| SHELLHART RD | 18 |
| ROCKCUT RD | 16 |
| RT 21 HWY | 16 |
| CLUBSIDE DR | 14 |
| HEMPHILL RD | 14 |
| MCCOY RD | 14 |
| SCOTT ST | 14 |
| COLUMBIA WOODS DR | 12 |
2002 - 2018 National Fire Incident Reporting System (NFIRS) incidents
- Incident types reported to NFIRS in Norton, OH
- 4,71658.6%Rescue & EMS
- 1,21815.1%Service Call
- 87310.9%Fire
- 5136.4%Hazardous Condition
- 4585.7%Good Intent Call
- 2423.0%False Alarm
- 190.2%Special Incident
- Fire incident types reported to NFIRS in Norton, OH
- 42248.3%Structure Fires
- 28232.3%Outside Fires
- 16719.1%Mobile Property/Vehicle Fires
- 20.2%Other
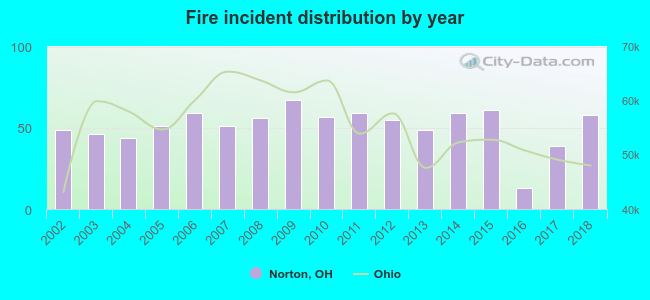 According to the data from the years 2002 - 2018 the average number of fire incidents per year is 51. The highest number of reported fire incidents - 67 took place in 2009, and the least - 13 in 2016. The data has an increasing trend.
The average number of yearly fire incidents per 10k residents in Norton, OH compared to nearest cities:
(Note: Based on data for the last 3 years, including only cities with population 5,000 and above)
| Norton: | 30.4 |
| Barberton: | 18.0 |
| Wadsworth: | 30.6 |
| Fairlawn: | 48.5 |
| Akron: | 43.8 |
| Rittman: | 43.2 |
| Canal Fulton: | 32.8 |
| Green: | 0.6 |
| Cuyahoga Falls: | 24.9 |
 The median response time based on all reported fire incidents is 7 minutes. This is close to the Ohio median value.
The median response time in Norton, OH compared to nearest cities:
(Note: Based on data for all years, including only cities with at least 500 fire incidents)
| Norton: | 7 minutes |
| Barberton: | 4 minutes |
| Wadsworth: | 6 minutes |
| Fairlawn: | 4 minutes |
| Akron: | 5 minutes |
| Canal Fulton: | 8 minutes |
| Cuyahoga Falls: | 4 minutes |
| Tallmadge: | 5 minutes |
| Uniontown: | 5 minutes |
 According to the reports from the years 2002 - 2018 the average number of fire-related casualties per year is 1. The highest number of reported casualties - 4 took place in 2008, and the lowest - 0 in 2005. The data has a declining trend.
The average number of casualties per 1,000 fire incidents is 10. This indicator was the highest - 71 in 2008, and the lowest 0 in 2005. The trend for injuries per 1,000 fires is declining. Compared to the state value the number of casualties per 1,000 fires is lower.
According to the reports from the years 2002 - 2018 the average number of fire-related casualties per year is 1. The highest number of reported casualties - 4 took place in 2008, and the lowest - 0 in 2005. The data has a declining trend.
The average number of casualties per 1,000 fire incidents is 10. This indicator was the highest - 71 in 2008, and the lowest 0 in 2005. The trend for injuries per 1,000 fires is declining. Compared to the state value the number of casualties per 1,000 fires is lower.Casualties per 1,000 incidents in Norton, OH compared to nearest cities:
(Note: Based on data for all years, including only cities with at least 500 fire incidents)
| Norton: | 10.3 |
| Barberton: | 38.0 |
| Wadsworth: | 17.4 |
| Fairlawn: | 11.0 |
| Akron: | 35.0 |
| Canal Fulton: | 5.5 |
| Cuyahoga Falls: | 41.0 |
| Tallmadge: | 23.7 |
| Uniontown: | 15.0 |
 33.7% incidents where reported in the morning and 66.3% in the evening. The most fires (16.0%) took place on Sunday, and the least (11.7%) on Friday.
 Based on the 873 incident reports from years 2002 - 2018 most fires (10.8%) took place during May, and the least (5.8%) in March.
 Out of all 8,044 cases reported during the years 2002 - 2018, the most belonged to the categories: Rescue & EMS (58.6%), Service Call (15.1%), and Fire (10.9%).
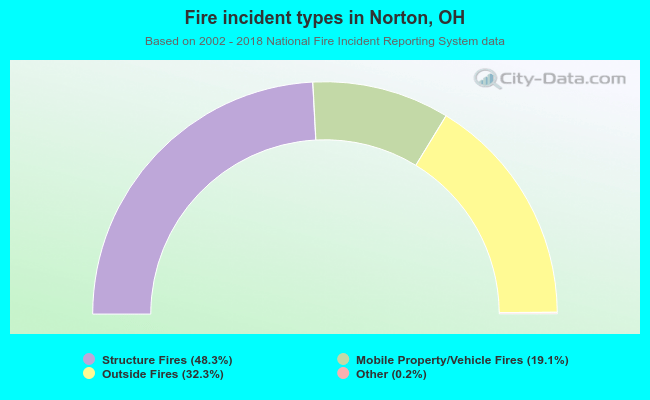 When looking into fire subcategories, the most incidents belonged to: Structure Fires (48.3%), and Outside Fires (32.3%).