Norton: Fire Incidents, Massachusetts (MA)
Where are fire incidents reported in Norton, MA
Something went wrong! Please refresh the page.
| Fire incidents reported | |
|---|---|
| Sreet name | Count |
| EAST MAIN STREET | 146 |
| MANSFIELD AVENUE | 98 |
| WEST MAIN STREET | 88 |
| SOUTH WORCESTER STR | 56 |
| TAUNTON AVENUE | 42 |
| DEAN STREET | 40 |
| NORTON GLEN ROAD | 34 |
| HARVEY STREET | 28 |
| SOUTH WASHINGTON ST | 28 |
| FILMORE DRIVE | 26 |
| MAIN ST | 26 |
| 495 NORTH | 24 |
| JOHN SCOTT BLVD | 22 |
| BAY ROAD | 20 |
| BURT STREET | 20 |
| NORTH WASHINGTON ST | 20 |
| OAK STREET | 18 |
| OLD COLONY ROAD | 18 |
| PINE STREET | 18 |
| PLAIN STREET | 18 |
| NORTH WORCESTER STR | 16 |
| UNION ROAD | 16 |
| EAST HODGES STREET | 14 |
| KING PHILIP ROAD | 14 |
| PLEASANT STREET | 14 |
| RESERVOIR STREET | 14 |
| WORCESTER ST | 14 |
| 495 SOUTH | 12 |
| HOWARD STREET | 12 |
| LINCOLN STREET | 12 |
2002 - 2018 National Fire Incident Reporting System (NFIRS) incidents
- Incident types reported to NFIRS in Norton, MA
- 7,52051.3%Rescue & EMS
- 1,99313.6%Hazardous Condition
- 1,72911.8%False Alarm
- 1,69711.6%Service Call
- 8485.8%Fire
- 6294.3%Special Incident
- 2281.6%Good Intent Call
- Fire incident types reported to NFIRS in Norton, MA
- 34640.8%Outside Fires
- 25530.1%Structure Fires
- 13916.4%Mobile Property/Vehicle Fires
- 10812.7%Other
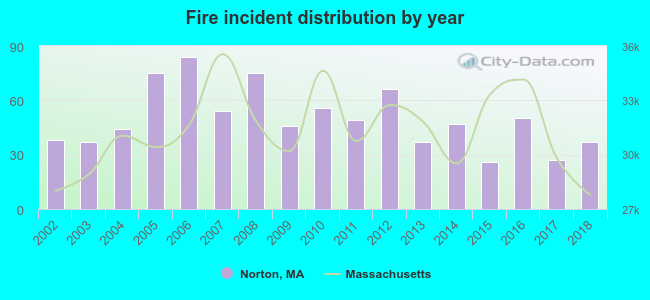 According to the data from the years 2002 - 2018 the average number of fires per year is 50. The highest number of reported fires - 84 took place in 2006, and the least - 26 in 2015. The data has a decreasing trend.
The average number of yearly fire incidents per 10k residents in Norton, MA compared to nearest cities:
(Note: Based on data for the last 3 years, including only cities with population 5,000 and above)
| Norton: | 20.0 |
| Mansfield: | 27.7 |
| Easton: | 23.4 |
| Taunton: | 25.0 |
| Attleboro: | 27.7 |
| Foxborough: | 96.0 |
| Raynham: | 53.8 |
| Plainville: | 44.0 |
| West Bridgewater: | 57.4 |
 The median response time based on all reported fire incidents is 4 minutes. This is about the same as the Massachusetts median value.
The median response time in Norton, MA compared to nearest cities:
(Note: Based on data for all years, including only cities with at least 500 fire incidents)
| Norton: | 4 minutes |
| Mansfield: | 5 minutes |
| Easton: | 5 minutes |
| Taunton: | 4 minutes |
| Attleboro: | 4 minutes |
| Foxborough: | 5 minutes |
| Raynham: | 4 minutes |
| Plainville: | 4 minutes |
| West Bridgewater: | 4 minutes |
 According to the data from the years 2002 - 2018 the average number of fire-related yearly casualties is 1. The highest number of reported injuries - 3 took place in 2004, and the lowest - 0 in 2005. The data has a constant trend.
The average number of casualties per 1,000 fires is 20. This indicator was the highest - 68 in 2004, and the lowest 0 in 2005. The trend for injuries per 1,000 incidents is rising. Compared to the Massachusetts value the number of casualties per 1,000 fires is higher.
According to the data from the years 2002 - 2018 the average number of fire-related yearly casualties is 1. The highest number of reported injuries - 3 took place in 2004, and the lowest - 0 in 2005. The data has a constant trend.
The average number of casualties per 1,000 fires is 20. This indicator was the highest - 68 in 2004, and the lowest 0 in 2005. The trend for injuries per 1,000 incidents is rising. Compared to the Massachusetts value the number of casualties per 1,000 fires is higher.Casualties per 1,000 incidents in Norton, MA compared to nearest cities:
(Note: Based on data for all years, including only cities with at least 500 fire incidents)
| Norton: | 18.9 |
| Mansfield: | 21.9 |
| Easton: | 49.1 |
| Taunton: | 0.8 |
| Attleboro: | 9.0 |
| Foxborough: | 5.5 |
| Raynham: | 2.1 |
| Plainville: | 7.6 |
| West Bridgewater: | 10.4 |
 29.4% incidents where reported in the morning and 70.6% in the evening. The most fires (16.0%) took place on Saturday, and the least (13.4%) on Sunday.
 According to the 848 reports from years 2002 - 2018 most fires (17.1%) took place during April, and the least (5.9%) in June.
 Out of all 14,649 cases reported during the years 2002 - 2018, the most belonged to the categories: Rescue & EMS (51.3%), Hazardous Condition (13.6%), and False Alarm (11.8%).
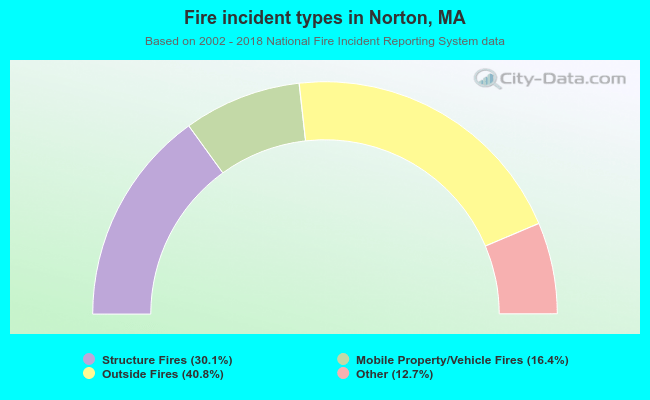 When looking into fire subcategories, the most incidents belonged to: Outside Fires (40.8%), and Structure Fires (30.1%).