New Philadelphia: Fire Incidents, Ohio (OH)
Where are fire incidents reported in New Philadelphia, OH
Something went wrong! Please refresh the page.
| Fire incidents reported | |
|---|---|
| Sreet name | Count |
| EAST HIGH AV | 48 |
| WEST HIGH AV | 46 |
| HIGH AVE | 44 |
| REISER AVE | 42 |
| FRONT AVE | 40 |
| 4TH ST | 38 |
| BROADWAY | 38 |
| BROADWAY SOUTH | 32 |
| 2ND ST | 30 |
| CROOKED RUN RD | 30 |
| TUSCARAWAS AVE | 30 |
| 3RD ST | 28 |
| BLUEBELL DR | 28 |
| COMMERCIAL AVE | 28 |
| MILL AVE | 28 |
| RAY AVE | 28 |
| FRONT AV SW | 26 |
| RIDGE RD | 26 |
| RAY AV NW | 24 |
| STONECREEK RD | 24 |
| WAINWRIGHT RD | 24 |
| WEST HIGH AVE | 24 |
| 4TH ST NW | 22 |
| BROADWAY NORTH | 22 |
| TUSCARAWAS AV NW | 22 |
| 3RD ST SW | 20 |
| BLUEBELL DR NW | 20 |
| STATE ROUTE 39 NE | 20 |
| UNIVERSITY DR | 20 |
| 5TH ST | 18 |
| Other | 835 |
2002 - 2018 National Fire Incident Reporting System (NFIRS) incidents
- Incident types reported to NFIRS in New Philadelphia, OH
- 5,45246.9%Rescue & EMS
- 1,83515.8%Hazardous Condition
- 1,70514.7%Fire
- 1,33911.5%Service Call
- 7076.1%Good Intent Call
- 4954.3%False Alarm
- 740.6%Special Incident
- 150.1%Overpressure Rupture
- Fire incident types reported to NFIRS in New Philadelphia, OH
- 97557.2%Structure Fires
- 41924.6%Outside Fires
- 26215.4%Mobile Property/Vehicle Fires
- 492.9%Other
 According to the data from the years 2002 - 2018 the average number of fires per year is 100. The highest number of fire incidents - 165 took place in 2003, and the least - 60 in 2016. The data has an increasing trend.
The average number of yearly fire incidents per 10k residents in New Philadelphia, OH compared to nearest cities:
(Note: Based on data for the last 3 years, including only cities with population 5,000 and above)
| New Philadelphia: | 37.1 |
| Dover: | 42.3 |
| Uhrichsville: | 115.4 |
| Massillon: | 27.6 |
| Canton: | 54.2 |
| Louisville: | 68.5 |
| Coshocton: | 100.5 |
| North Canton: | 32.2 |
| Canal Fulton: | 32.8 |
 The median response time based on all reported fire incidents is 6 minutes. This is close to the Ohio median value.
The median response time in New Philadelphia, OH compared to nearest cities:
(Note: Based on data for all years, including only cities with at least 500 fire incidents)
| New Philadelphia: | 6 minutes |
| Dover: | 6 minutes |
| Uhrichsville: | 6 minutes |
| Sugarcreek: | 11 minutes |
| Navarre: | 10 minutes |
| Newcomerstown: | 11 minutes |
| Carrollton: | 12 minutes |
| Massillon: | 5 minutes |
| Canton: | 5 minutes |
 Based on the data from the years 2002 - 2018 the average number of fire-related yearly casualties is 0. The highest number of casualties - 2 took place in 2006, and the lowest - 0 in 2002. The data has a constant trend.
The average number of casualties per 1,000 fire incidents is 2. This indicator was the highest - 20 in 2006, and the lowest 0 in 2002. The trend for casualties per 1,000 incidents is constant. Compared to the state value the number of casualties per 1,000 fire incidents is much lower.
Based on the data from the years 2002 - 2018 the average number of fire-related yearly casualties is 0. The highest number of casualties - 2 took place in 2006, and the lowest - 0 in 2002. The data has a constant trend.
The average number of casualties per 1,000 fire incidents is 2. This indicator was the highest - 20 in 2006, and the lowest 0 in 2002. The trend for casualties per 1,000 incidents is constant. Compared to the state value the number of casualties per 1,000 fire incidents is much lower.Casualties per 1,000 incidents in New Philadelphia, OH compared to nearest cities:
(Note: Based on data for all years, including only cities with at least 500 fire incidents)
| New Philadelphia: | 2.3 |
| Dover: | 22.4 |
| Uhrichsville: | 11.8 |
| Sugarcreek: | 5.7 |
| Navarre: | 9.2 |
| Newcomerstown: | 2.4 |
| Carrollton: | 5.6 |
| Massillon: | 13.5 |
| Canton: | 23.7 |
 29.8% incidents where reported in the morning and 70.2% in the evening. The most fires (16.5%) took place on Monday, and the least (11.7%) on Friday.
 According to the 1,705 fire incidents from years 2002 - 2018 most fires (10.6%) took place during March, and the least (6.2%) in December.
 Out of all 11,632 cases reported during the years 2002 - 2018, the most belonged to the categories: Rescue & EMS (46.9%), Hazardous Condition (15.8%), and Fire (14.7%).
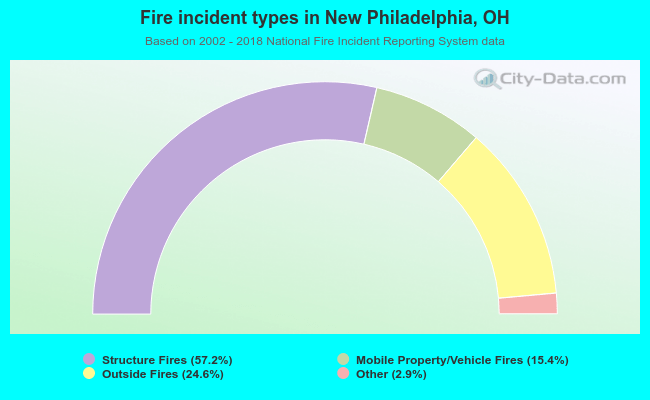 When looking into fire subcategories, the most reports belonged to: Structure Fires (57.2%), and Outside Fires (24.6%).