Mount Vernon: Fire Incidents, Ohio (OH)
Where are fire incidents reported in Mount Vernon, OH
Something went wrong! Please refresh the page.
| Fire incidents reported | |
|---|---|
| Sreet name | Count |
| COLUMBUS RD | 146 |
| COSHOCTON AV. | 84 |
| MARTINSBURG RD | 76 |
| WOOSTER RD | 66 |
| SYCAMORE RD | 52 |
| NEWARK RD | 48 |
| YAUGER RD | 46 |
| N. SANDUSKY ST | 38 |
| MCGIBNEY RD | 36 |
| SYCHAR RD | 34 |
| COSHOCTON AVE | 32 |
| COSHOCTON RD | 32 |
| OLD DELAWARE RD | 32 |
| GRANVILLE RD | 30 |
| N. MULBERRY ST | 30 |
| NEW GAMBIER RD | 30 |
| MAIN ST | 28 |
| W. GAMBIER ST | 28 |
| BEECH ST | 26 |
| HARCOURT RD | 26 |
| HOWARD ST | 26 |
| MARION ST | 26 |
| MURRAY RD | 26 |
| UPPER GILCHRIST RD | 26 |
| S. MAIN ST | 24 |
| TILDEN AVE | 24 |
| GAMBIER RD | 22 |
| GAMBIER ST | 22 |
| OLD MANSFIELD RD | 22 |
| TUCKER RD | 22 |
| Other | 340 |
2002 - 2018 National Fire Incident Reporting System (NFIRS) incidents
- Incident types reported to NFIRS in Mount Vernon, OH
- 9,18556.4%Rescue & EMS
- 2,04212.5%Service Call
- 1,68910.4%Hazardous Condition
- 1,5009.2%Fire
- 1,2647.8%Good Intent Call
- 5523.4%False Alarm
- 300.2%Overpressure Rupture
- Fire incident types reported to NFIRS in Mount Vernon, OH
- 80653.7%Structure Fires
- 43028.7%Outside Fires
- 25016.7%Mobile Property/Vehicle Fires
- 140.9%Other
 Based on the data from the years 2002 - 2018 the average number of fires per year is 88. The highest number of reported fire incidents - 137 took place in 2008, and the least - 25 in 2011. The data has an increasing trend.
The average number of yearly fire incidents per 10k residents in Mount Vernon, OH compared to nearest cities:
(Note: Based on data for the last 3 years, including only cities with population 5,000 and above)
| Mount Vernon: | 60.2 |
| Granville: | 67.0 |
| Newark: | 78.7 |
| Heath: | 58.0 |
| Mansfield: | 83.5 |
| Ontario: | 34.8 |
| New Albany: | 42.0 |
| Galion: | 54.7 |
| Pataskala: | 73.5 |
 The median response time based on all reported fire incidents is 6 minutes. This is similar to the Ohio median value.
The median response time in Mount Vernon, OH compared to nearest cities:
(Note: Based on data for all years, including only cities with at least 500 fire incidents)
| Mount Vernon: | 6 minutes |
| Fredericktown: | 11 minutes |
| Howard: | 9 minutes |
| Utica: | 11 minutes |
| Danville: | 8 minutes |
| Centerburg: | 9 minutes |
| Marengo: | 13 minutes |
| Johnstown: | 8 minutes |
| Lexington: | 10 minutes |
 28.3% incidents where reported in the morning and 71.7% in the evening. The most fires (15.5%) took place on Thursday, and the least (12.9%) on Wednesday.
 According to the 1,500 fires from years 2002 - 2018 most fires (10.1%) took place during April, and the least (7.1%) in May.
 Out of all 16,288 cases reported during the years 2002 - 2018, the most belonged to the categories: Rescue & EMS (56.4%), Service Call (12.5%), and Hazardous Condition (10.4%).
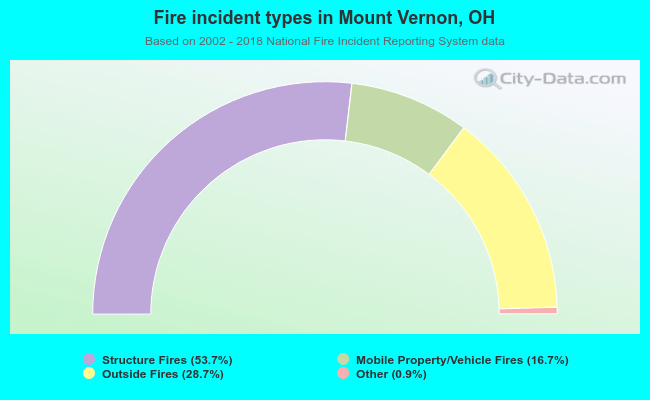 When looking into fire subcategories, the most incidents belonged to: Structure Fires (53.7%), and Outside Fires (28.7%).