Mount Prospect: Fire Incidents, Illinois (IL)
Where are fire incidents reported in Mount Prospect, IL
Something went wrong! Please refresh the page.
| Fire incidents reported | |
|---|---|
| Sreet name | Count |
| ALGONQUIN RD | 170 |
| ELMHURST RD | 128 |
| BUSSE RD | 88 |
| FOREST COVE DR | 88 |
| DEMPSTER ST | 78 |
| GOLF RD | 54 |
| CENTRAL RD | 52 |
| RAND RD | 48 |
| ELMHURST RD | 42 |
| BUSSE RD | 40 |
| ALGONQUIN RD | 38 |
| BOXWOOD DR | 38 |
| COTTONWOOD LN | 38 |
| NORTHWEST HWY | 38 |
| MAIN ST | 32 |
| GREGORY ST | 30 |
| PALM DR | 30 |
| DEMPSTER | 28 |
| EUCLID AV | 28 |
| HUNTINGTON COMMONS RD | 28 |
| BUSSE | 26 |
| CENTRAL RD | 26 |
| DEMPSTER ST | 26 |
| EUCLID AV | 24 |
| KENSINGTON RD | 24 |
| RAND RD | 24 |
| WHEELING RD | 24 |
| ALGONQUIN | 22 |
| EMERSON ST | 22 |
| LONNQUIST BLV | 22 |
| Other | 391 |
2004 - 2018 National Fire Incident Reporting System (NFIRS) incidents
- Incident types reported to NFIRS in Mount Prospect, IL
- 17,52763.7%Rescue & EMS
- 3,06611.2%Hazardous Condition
- 2,4759.0%False Alarm
- 1,7476.4%Fire
- 1,3394.9%Good Intent Call
- 1,2824.7%Service Call
- 290.1%Special Incident
- Fire incident types reported to NFIRS in Mount Prospect, IL
- 89551.2%Structure Fires
- 55531.8%Outside Fires
- 19611.2%Mobile Property/Vehicle Fires
- 1015.8%Other
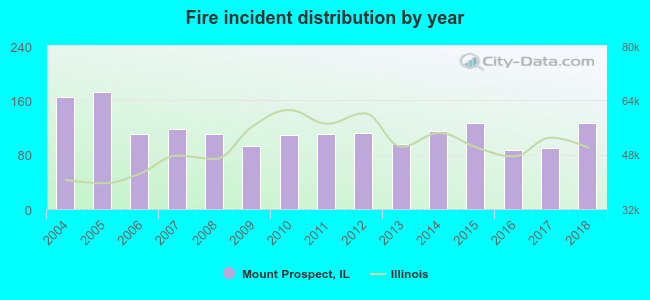 According to the data from the years 2004 - 2018 the average number of fire incidents per year is 116. The highest number of reported fire incidents - 173 took place in 2005, and the least - 87 in 2016. The data has a dropping trend.
The average number of yearly fire incidents per 10k residents in Mount Prospect, IL compared to nearest cities:
(Note: Based on data for the last 3 years, including only cities with population 5,000 and above)
| Mount Prospect: | 18.4 |
| Prospect Heights: | 27.4 |
| Des Plaines: | 30.8 |
| Arlington Heights: | 3.7 |
| Wheeling: | 19.4 |
| Rolling Meadows: | 23.9 |
| Elk Grove Village: | 36.0 |
| Park Ridge: | 14.3 |
| Glenview: | 16.3 |
 The median response time based on all reported fire incidents is 5 minutes. This is about the same as the state median value.
The median response time in Mount Prospect, IL compared to nearest cities:
(Note: Based on data for all years, including only cities with at least 500 fire incidents)
| Mount Prospect: | 5 minutes |
| Prospect Heights: | 5 minutes |
| Des Plaines: | 5 minutes |
| Arlington Heights: | 5 minutes |
| Wheeling: | 5 minutes |
| Rolling Meadows: | 5 minutes |
| Elk Grove Village: | 5 minutes |
| Park Ridge: | 5 minutes |
| Glenview: | 5 minutes |
 According to the data from the years 2004 - 2018 the average number of fire-related fatalities per year is 0. The highest number of reported deaths - 2 took place in 2006, and the lowest - 0 in 2004. The data has an increasing trend.
 Based on the reports from the years 2004 - 2018 the average number of fire-related casualties per year is 3. The highest number of reported casualties - 6 took place in 2011, and the lowest - 1 in 2009. The data has a growing trend.
The average number of casualties per 1,000 fire incidents is 28. This indicator was the highest - 55 in 2011, and the lowest 11 in 2009. The trend for injuries per 1,000 fire incidents is growing. Compared to the state value the number of injuries per 1,000 fires is much higher.
Based on the reports from the years 2004 - 2018 the average number of fire-related casualties per year is 3. The highest number of reported casualties - 6 took place in 2011, and the lowest - 1 in 2009. The data has a growing trend.
The average number of casualties per 1,000 fire incidents is 28. This indicator was the highest - 55 in 2011, and the lowest 11 in 2009. The trend for injuries per 1,000 fire incidents is growing. Compared to the state value the number of injuries per 1,000 fires is much higher.Casualties per 1,000 incidents in Mount Prospect, IL compared to nearest cities:
(Note: Based on data for all years, including only cities with at least 500 fire incidents)
| Mount Prospect: | 28.0 |
| Prospect Heights: | 20.1 |
| Des Plaines: | 37.0 |
| Arlington Heights: | 31.4 |
| Wheeling: | 57.3 |
| Rolling Meadows: | 19.4 |
| Elk Grove Village: | 14.2 |
| Park Ridge: | 16.8 |
| Glenview: | 17.9 |
 34.2% incidents where reported in the morning and 65.8% in the evening. The most fires (17.9%) took place on Saturday, and the least (12.7%) on Sunday.
 According to the 1,747 incident reports from years 2004 - 2018 most fires (12.7%) took place during July, and the least (5.5%) in December.
 Out of all 27,496 cases reported during the years 2004 - 2018, the most belonged to the categories: Rescue & EMS (63.7%), Hazardous Condition (11.2%), and False Alarm (9.0%).
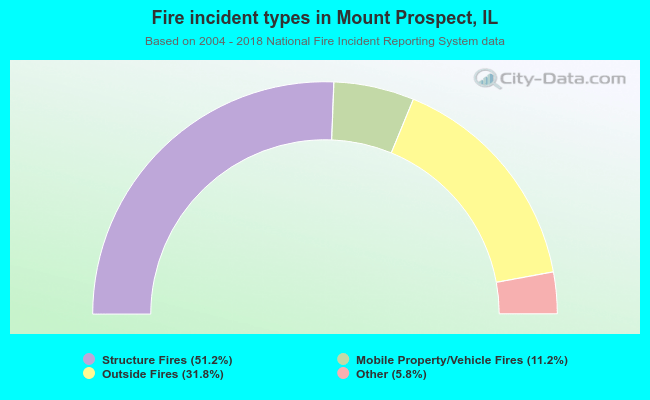 When looking into fire subcategories, the most reports belonged to: Structure Fires (51.2%), and Outside Fires (31.8%).