Monticello: Fire Incidents, Kentucky (KY)
Where are fire incidents reported in Monticello, KY
Something went wrong! Please refresh the page.
| Fire incidents reported | |
|---|---|
| Sreet name | Count |
| MAIN ST | 138 |
| 92 HWY | 126 |
| 90 HWY | 92 |
| 1275 HWY | 70 |
| 167 HWY | 62 |
| 3106 HWY | 48 |
| 776 HWY | 46 |
| COLUMBIA AVE | 38 |
| HWY 90 HWY | 36 |
| HILLARD AVE | 34 |
| HWY 92 HWY | 34 |
| SECOND ST | 34 |
| POND RD | 32 |
| STOKES ST | 32 |
| WEST HWY 90 | 32 |
| CHERRY ST | 30 |
| FIRST ST | 30 |
| CUMBERLAND CROSSING | 28 |
| 200 HWY | 26 |
| 789 HWY | 26 |
| LINCOLN AVE | 26 |
| RIDGEWOOD AVE | 24 |
| BOONE ST | 22 |
| CONCORD RD | 22 |
| HWY 92 | 22 |
| HWY 1546 | 20 |
| HWY 3106 HWY | 20 |
| HWY 90 | 20 |
| MICHIGAN AVE | 20 |
| STOKES RD | 20 |
| Other | 842 |
2002 - 2018 National Fire Incident Reporting System (NFIRS) incidents
- Incident types reported to NFIRS in Monticello, KY
- 2,71251.8%Hazardous Condition
- 2,05239.2%Fire
- 1532.9%Good Intent Call
- 1092.1%False Alarm
- 971.9%Rescue & EMS
- 951.8%Special Incident
- 180.3%Service Call
- Fire incident types reported to NFIRS in Monticello, KY
- 85941.9%Structure Fires
- 70834.5%Outside Fires
- 30715.0%Mobile Property/Vehicle Fires
- 1788.7%Other
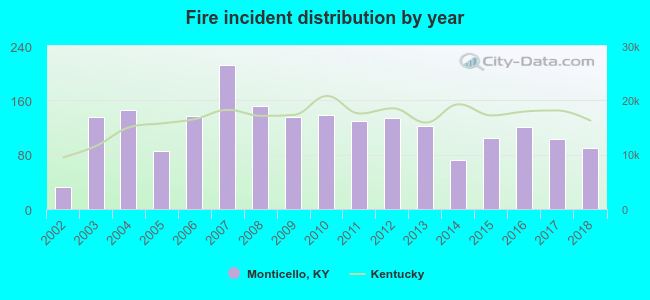 Based on the data from the years 2002 - 2018 the average number of fire incidents per year is 121. The highest number of fire incidents - 212 took place in 2007, and the least - 32 in 2002. The data has an increasing trend.
The average number of yearly fire incidents per 10k residents in Monticello, KY compared to nearest cities:
(Note: Based on data for the last 3 years, including only cities with population 5,000 and above)
| Monticello: | 171.7 |
| Nancy: | 32.2 |
| Somerset: | 154.4 |
| Waynesburg: | 64.9 |
| Keavy: | 3.3 |
| Williamsburg: | 231.3 |
| Corbin: | 151.9 |
| Campbellsville: | 62.0 |
| London: | 195.7 |
 The median response time based on all reported fire incidents is 10 minutes. This is higher compared to the state median value.
The median response time in Monticello, KY compared to nearest cities:
(Note: Based on data for all years, including only cities with at least 500 fire incidents)
| Monticello: | 10 minutes |
| Russell Springs: | 8 minutes |
| Somerset: | 7 minutes |
| Science Hill: | 9 minutes |
| Burkesville: | 13 minutes |
| Columbia: | 12 minutes |
| Eubank: | 10 minutes |
| Liberty: | 9 minutes |
| Williamsburg: | 10 minutes |
 According to the data from the years 2002 - 2018 the average number of fire-related fatalities per year is 0. The highest number of deaths - 3 took place in 2013, and the lowest - 0 in 2006. The data has a declining trend.
 Based on the reports from the years 2002 - 2018 the average number of fire-related yearly casualties is 1. The highest number of reported casualties - 4 took place in 2009, and the lowest - 0 in 2002. The data has a constant trend.
The average number of injuries per 1,000 fires is 9. This indicator was the highest - 30 in 2009, and the lowest 0 in 2002. The trend for injuries per 1,000 incidents is constant. Compared to the Kentucky value the number of casualties per 1,000 fires is higher.
Based on the reports from the years 2002 - 2018 the average number of fire-related yearly casualties is 1. The highest number of reported casualties - 4 took place in 2009, and the lowest - 0 in 2002. The data has a constant trend.
The average number of injuries per 1,000 fires is 9. This indicator was the highest - 30 in 2009, and the lowest 0 in 2002. The trend for injuries per 1,000 incidents is constant. Compared to the Kentucky value the number of casualties per 1,000 fires is higher.Casualties per 1,000 incidents in Monticello, KY compared to nearest cities:
(Note: Based on data for all years, including only cities with at least 500 fire incidents)
| Monticello: | 9.7 |
| Russell Springs: | 0.0 |
| Somerset: | 1.6 |
| Science Hill: | 0.0 |
| Burkesville: | 0.0 |
| Columbia: | 0.0 |
| Eubank: | 0.0 |
| Liberty: | 0.9 |
| Williamsburg: | 13.2 |
 36.0% incidents where reported in the morning and 64.0% in the evening. The most fires (16.7%) took place on Saturday, and the least (13.2%) on Thursday.
 According to the 2,052 fire incident reports from years 2002 - 2018 most fires (11.8%) took place during November, and the least (5.7%) in May.
 Out of all 5,239 cases reported during the years 2002 - 2018, the most belonged to the categories: Hazardous Condition (51.8%), Fire (39.2%), and Good Intent Call (2.9%).
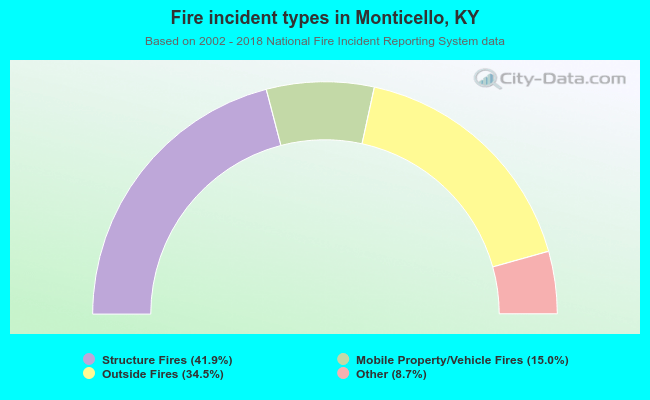 When looking into fire subcategories, the most reports belonged to: Structure Fires (41.9%), and Outside Fires (34.5%).