Monterey: Fire Incidents, California (CA)
Where are fire incidents reported in Monterey, CA
Something went wrong! Please refresh the page.
| Fire incidents reported | |
|---|---|
| Sreet name | Count |
| DEL MONTE AVE | 106 |
| PRESIDIO | 76 |
| CANNERY ROW | 74 |
| FREMONT ST | 74 |
| MUNRAS AVE | 56 |
| LIGHTHOUSE AVE | 54 |
| ALVARADO ST | 46 |
| CASANOVA AVE | 40 |
| HIGHWAY1 | 40 |
| HOLMAN HWY | 40 |
| PEARL ST | 40 |
| HIGHWAY #1 | 38 |
| FOAM ST | 34 |
| FRANKLIN ST | 34 |
| CASA VERDE WAY | 30 |
| DAVID AVE | 30 |
| DELA VINA AVE | 28 |
| GLENWOOD CIR | 28 |
| HAWTHORNE ST | 28 |
| PACIFIC ST | 28 |
| AGUAJITO RD | 26 |
| DEL MONTE CENTER | 26 |
| HERRMANN DR | 24 |
| RAMONA AVE | 24 |
| VAN BUREN ST | 22 |
| GARDEN RD | 20 |
| WATSON ST | 20 |
| MONROE ST | 18 |
| SURF WAY | 18 |
| WHARF #1 | 18 |
| Other | 274 |
2002 - 2018 National Fire Incident Reporting System (NFIRS) incidents
- Incident types reported to NFIRS in Monterey, CA
- 15,28056.4%Rescue & EMS
- 3,11511.5%Hazardous Condition
- 2,79010.3%Good Intent Call
- 2,4669.1%Service Call
- 1,9727.3%False Alarm
- 1,4145.2%Fire
- 420.2%Overpressure Rupture
- 300.1%Severe Weather
- Fire incident types reported to NFIRS in Monterey, CA
- 61543.5%Outside Fires
- 51336.3%Structure Fires
- 21915.5%Mobile Property/Vehicle Fires
- 674.7%Other
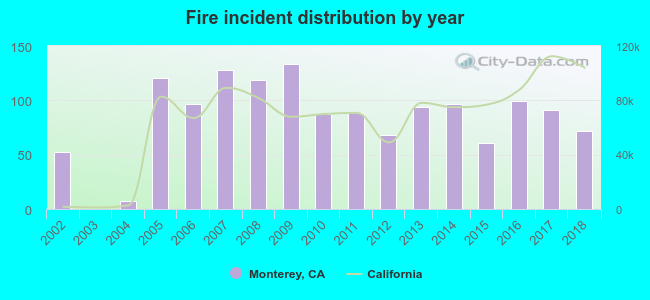 Based on the data from the years 2002 - 2018 the average number of fires per year is 83. The highest number of fire incidents - 133 took place in 2009, and the least - 0 in 2003. The data has an increasing trend.
The average number of yearly fire incidents per 10k residents in Monterey, CA compared to nearest cities:
(Note: Based on data for the last 3 years, including only cities with population 5,000 and above)
| Monterey: | 30.9 |
| Pacific Grove: | 14.5 |
| Seaside: | 14.8 |
| Carmel: | 11.7 |
| Marina: | 29.8 |
| Castroville: | 43.2 |
| Salinas: | 20.1 |
| Carmel Valley: | 19.7 |
| Prunedale: | 20.7 |
 The median response time based on all reported fire incidents is 4 minutes. This is lower than the state median value.
The median response time in Monterey, CA compared to nearest cities:
(Note: Based on data for all years, including only cities with at least 500 fire incidents)
| Monterey: | 4 minutes |
| Seaside: | 4 minutes |
| Marina: | 6 minutes |
| Salinas: | 7 minutes |
| Prunedale: | 8 minutes |
| Watsonville: | 11 minutes |
| Aptos: | 7 minutes |
| Santa Cruz: | 6 minutes |
| Live Oak: | 6 minutes |
 According to the reports from the years 2002 - 2018 the average number of fire-related yearly casualties is 1. The highest number of injuries - 4 took place in 2018, and the lowest - 0 in 2002. The data has a growing trend.
The average number of injuries per 1,000 fires is 13. This indicator was the highest - 56 in 2018, and the lowest 0 in 2002. The trend for casualties per 1,000 incidents is growing. Compared to the state value the number of injuries per 1,000 fire incidents is much higher.
According to the reports from the years 2002 - 2018 the average number of fire-related yearly casualties is 1. The highest number of injuries - 4 took place in 2018, and the lowest - 0 in 2002. The data has a growing trend.
The average number of injuries per 1,000 fires is 13. This indicator was the highest - 56 in 2018, and the lowest 0 in 2002. The trend for casualties per 1,000 incidents is growing. Compared to the state value the number of injuries per 1,000 fire incidents is much higher.Casualties per 1,000 incidents in Monterey, CA compared to nearest cities:
(Note: Based on data for all years, including only cities with at least 500 fire incidents)
| Monterey: | 12.7 |
| Seaside: | 27.2 |
| Marina: | 19.9 |
| Salinas: | 5.9 |
| Prunedale: | 3.8 |
| Watsonville: | 2.4 |
| Aptos: | 12.8 |
| Santa Cruz: | 11.8 |
| Live Oak: | 9.0 |
 34.4% incidents where reported in the morning and 65.6% in the evening. The most fires (15.3%) took place on Wednesday, and the least (13.5%) on Saturday.
 Based on the 1,414 reports from years 2002 - 2018 most fires (10.7%) took place during July, and the least (6.1%) in January.
 Out of all 27,116 cases reported during the years 2002 - 2018, the most belonged to the categories: Rescue & EMS (56.4%), Hazardous Condition (11.5%), and Good Intent Call (10.3%).
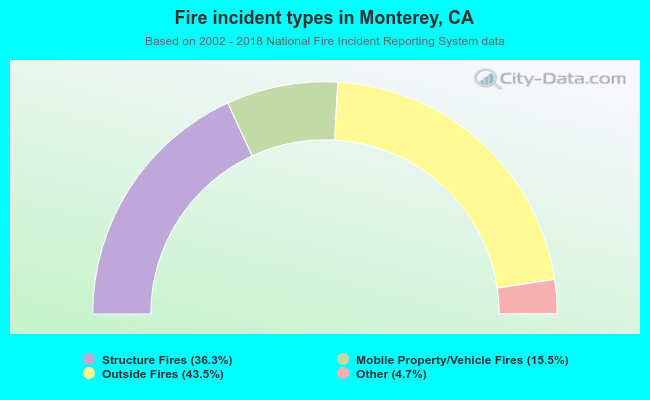 When looking into fire subcategories, the most reports belonged to: Outside Fires (43.5%), and Structure Fires (36.3%).