Minden: Fire Incidents, Louisiana (LA)
Where are fire incidents reported in Minden, LA
Something went wrong! Please refresh the page.
| Fire incidents reported | |
|---|---|
| Sreet name | Count |
| SHREVEPORT RD | 62 |
| HOMER RD | 58 |
| DORCHEAT RD | 56 |
| SIBLEY RD | 48 |
| GERMANTOWN RD | 44 |
| SHEPPARD ST | 42 |
| DOGWOOD TRL | 40 |
| OLD ARCADIA RD | 40 |
| 80 HWY | 38 |
| LEWISVILLE RD | 38 |
| I20 HWY | 30 |
| COUNTRY CLUB CIR | 26 |
| I-20 | 26 |
| LEE ST | 26 |
| PENAL FARM RD | 24 |
| PINE ST | 24 |
| CANEY LAKE RD | 22 |
| CAROLINA ST | 22 |
| I 20 HWY | 22 |
| ALLEN DR | 20 |
| TALTON ST | 20 |
| WINWOOD DR | 20 |
| 159 HWY | 18 |
| 371 HWY | 18 |
| EAST UNION ST | 18 |
| 79 HWY | 16 |
| FULLER RD | 16 |
| HOMER RD | 16 |
| HWY 80 | 16 |
| TANGLEWOOD DR | 16 |
| Other | 561 |
2002 - 2018 National Fire Incident Reporting System (NFIRS) incidents
- Incident types reported to NFIRS in Minden, LA
- 1,44341.4%Fire
- 88725.4%Good Intent Call
- 42712.2%Hazardous Condition
- 3018.6%Service Call
- 2958.5%False Alarm
- 1203.4%Rescue & EMS
- 70.2%Severe Weather
- 70.2%Special Incident
- Fire incident types reported to NFIRS in Minden, LA
- 66846.3%Outside Fires
- 46932.5%Structure Fires
- 25917.9%Mobile Property/Vehicle Fires
- 473.3%Other
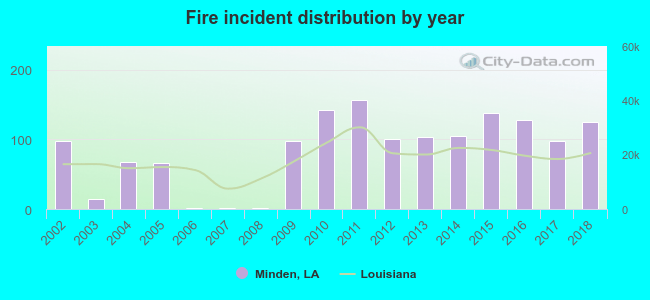 According to the data from the years 2002 - 2018 the average number of fires per year is 85. The highest number of fires - 156 took place in 2011, and the least - 1 in 2007. The data has a growing trend.
The average number of yearly fire incidents per 10k residents in Minden, LA compared to nearest cities:
(Note: Based on data for the last 3 years, including only cities with population 5,000 and above)
| Minden: | 91.1 |
| Bossier City: | 10.3 |
| Springhill: | 69.0 |
| Shreveport: | 63.1 |
| Grambling: | 33.8 |
| Ruston: | 42.6 |
| Mansfield: | 78.6 |
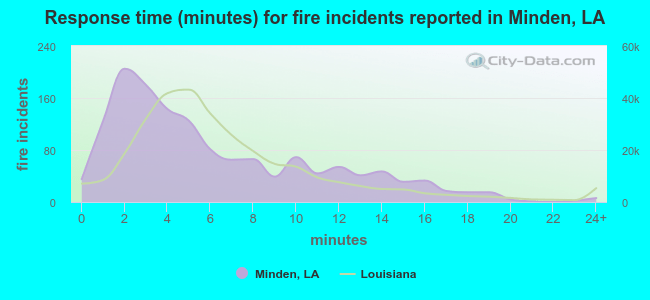 The median response time based on all reported fire incidents is 5 minutes. This is lower than the Louisiana median value.
The median response time in Minden, LA compared to nearest cities:
(Note: Based on data for all years, including only cities with at least 500 fire incidents)
| Minden: | 5 minutes |
| Haughton: | 6 minutes |
| Homer: | 7 minutes |
| Ringgold: | 8 minutes |
| Bossier City: | 4 minutes |
| Haynesville: | 6 minutes |
| Benton: | 7 minutes |
| Springhill: | 5 minutes |
| Simsboro: | 9 minutes |
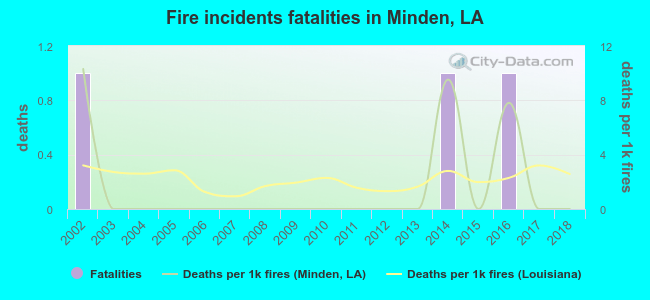 According to the data from the years 2002 - 2018 the average number of fire-related fatalities per year is 0. The highest number of deaths - 1 took place in 2002, and the lowest - 0 in 2003. The data has a dropping trend.
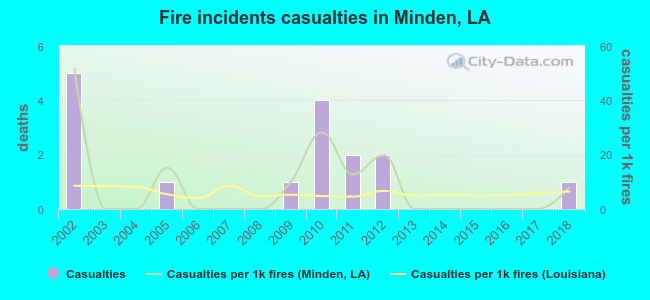 According to the reports from the years 2002 - 2018 the average number of fire-related yearly casualties is 1. The highest number of reported casualties - 5 took place in 2002, and the lowest - 0 in 2003. The data has a dropping trend.
The average number of injuries per 1,000 fires is 9. This indicator was the highest - 52 in 2002, and the lowest 0 in 2003. The trend for casualties per 1,000 fires is dropping. Compared to the state value the number of casualties per 1,000 fire incidents is higher.
According to the reports from the years 2002 - 2018 the average number of fire-related yearly casualties is 1. The highest number of reported casualties - 5 took place in 2002, and the lowest - 0 in 2003. The data has a dropping trend.
The average number of injuries per 1,000 fires is 9. This indicator was the highest - 52 in 2002, and the lowest 0 in 2003. The trend for casualties per 1,000 fires is dropping. Compared to the state value the number of casualties per 1,000 fire incidents is higher.Casualties per 1,000 incidents in Minden, LA compared to nearest cities:
(Note: Based on data for all years, including only cities with at least 500 fire incidents)
| Minden: | 11.1 |
| Haughton: | 4.2 |
| Homer: | 5.1 |
| Ringgold: | 2.8 |
| Bossier City: | 11.9 |
| Haynesville: | 6.5 |
| Benton: | 4.4 |
| Springhill: | 10.6 |
| Simsboro: | 11.8 |
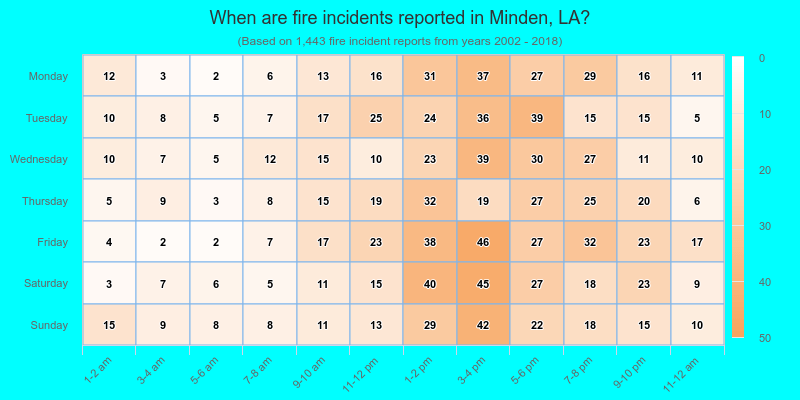
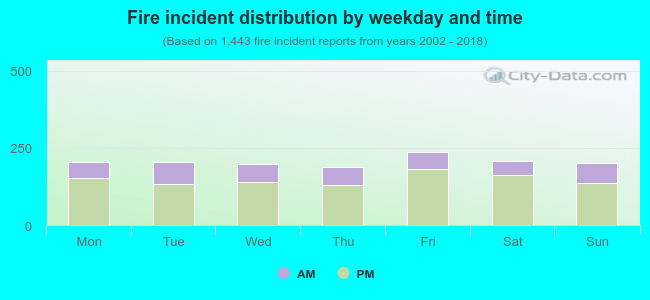 28.3% incidents where reported in the morning and 71.7% in the evening. The most fires (16.5%) took place on Friday, and the least (13.0%) on Thursday.
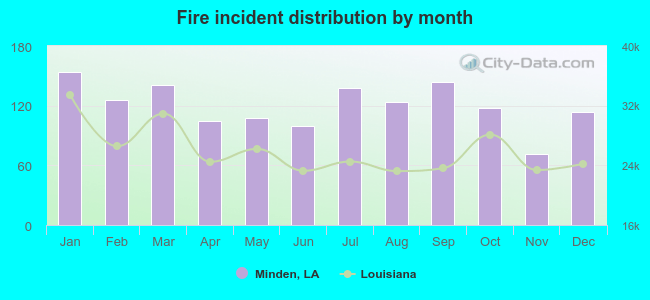 According to the 1,443 reports from years 2002 - 2018 most fires (10.7%) took place during January, and the least (4.9%) in November.
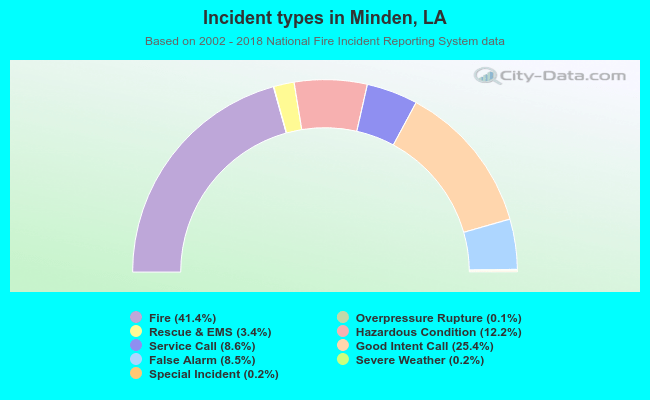 Out of all 3,489 cases reported during the years 2002 - 2018, the most belonged to the categories: Fire (41.4%), Good Intent Call (25.4%), and Hazardous Condition (12.2%).
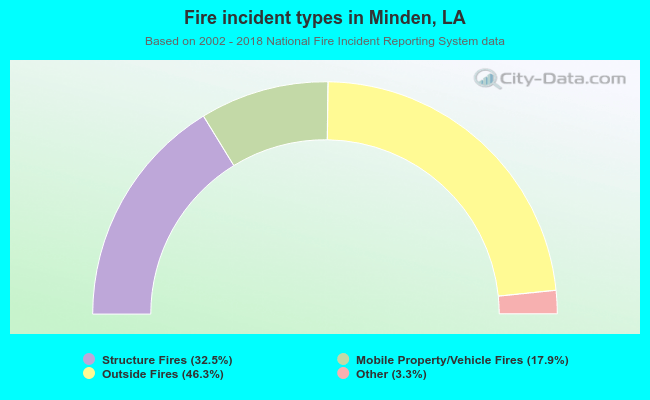 When looking into fire subcategories, the most incidents belonged to: Outside Fires (46.3%), and Structure Fires (32.5%).