Methuen: Fire Incidents, Massachusetts (MA)
Where are fire incidents reported in Methuen, MA
Something went wrong! Please refresh the page.
| Fire incidents reported | |
|---|---|
| Sreet name | Count |
| PLEASANT VALLEY ST | 276 |
| BROADWAY | 274 |
| LOWELL ST | 168 |
| OAKLAND AVE | 160 |
| HAVERHILL ST | 132 |
| MERRIMACK ST | 128 |
| PELHAM ST | 118 |
| MYSTIC ST | 96 |
| EAST ST | 82 |
| OSGOOD ST | 82 |
| HOWE ST | 74 |
| RIVERSIDE DR | 72 |
| HAMPSHIRE RD | 64 |
| JACKSON ST | 64 |
| DANBURY DR | 60 |
| WASHINGTON ST | 60 |
| PLEASANT ST | 58 |
| BURNHAM RD | 54 |
| UNION ST | 48 |
| GRANITE ST | 38 |
| NORTH LOWELL ST | 38 |
| RAILROAD ST | 36 |
| LAWRENCE ST | 34 |
| HAMPSHIRE ST | 32 |
| PROSPECT ST | 32 |
| PHILLIPS ST | 30 |
| SWAN ST | 28 |
| EDGEWOOD AVE | 26 |
| GILL AVE | 26 |
| HAMPSTEAD ST | 26 |
| Other | 172 |
2002 - 2018 National Fire Incident Reporting System (NFIRS) incidents
- Incident types reported to NFIRS in Methuen, MA
- 28,93564.2%Rescue & EMS
- 4,54710.1%False Alarm
- 3,8518.5%Hazardous Condition
- 3,6458.1%Service Call
- 2,5885.7%Fire
- 1,2342.7%Good Intent Call
- 2190.5%Special Incident
- Fire incident types reported to NFIRS in Methuen, MA
- 1,05740.8%Structure Fires
- 65425.3%Outside Fires
- 44217.1%Other
- 43516.8%Mobile Property/Vehicle Fires
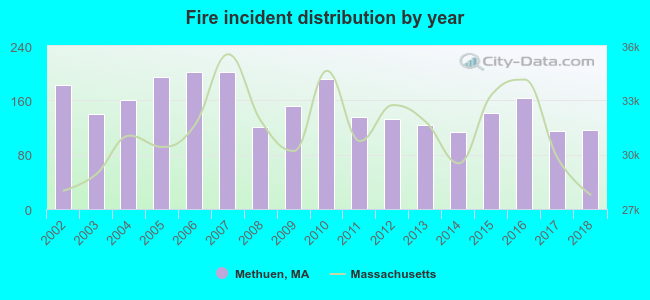 Based on the data from the years 2002 - 2018 the average number of fires per year is 152. The highest number of fires - 202 took place in 2006, and the least - 114 in 2014. The data has a decreasing trend.
The average number of yearly fire incidents per 10k residents in Methuen, MA compared to nearest cities:
(Note: Based on data for the last 3 years, including only cities with population 5,000 and above)
| Methuen: | 26.7 |
| Lawrence: | 26.0 |
| North Andover: | 38.9 |
| Andover: | 113.4 |
| Haverhill: | 33.9 |
| Dracut: | 20.3 |
| Groveland: | 32.5 |
| Tewksbury: | 29.8 |
| Lowell: | 41.4 |
 The median response time based on all reported fire incidents is 4 minutes. This is close to the state median value.
The median response time in Methuen, MA compared to nearest cities:
(Note: Based on data for all years, including only cities with at least 500 fire incidents)
| Methuen: | 4 minutes |
| Lawrence: | 3 minutes |
| North Andover: | 4 minutes |
| Andover: | 6 minutes |
| Haverhill: | 4 minutes |
| Dracut: | 5 minutes |
| Tewksbury: | 4 minutes |
| Lowell: | 3 minutes |
| Georgetown: | 5 minutes |
 According to the data from the years 2002 - 2018 the average number of fire-related yearly deaths is 1. The highest number of deaths - 3 took place in 2014, and the lowest - 0 in 2004. The data has a dropping trend.
The average number of deaths per 1,000 fire incidents is 4. This indicator was the highest - 26 in 2014, and the lowest 0 in 2004. The trend for deaths per 1,000 fire incidents is dropping. Compared to the state value the number of deaths per 1,000 fire incidents is much higher.
According to the data from the years 2002 - 2018 the average number of fire-related yearly deaths is 1. The highest number of deaths - 3 took place in 2014, and the lowest - 0 in 2004. The data has a dropping trend.
The average number of deaths per 1,000 fire incidents is 4. This indicator was the highest - 26 in 2014, and the lowest 0 in 2004. The trend for deaths per 1,000 fire incidents is dropping. Compared to the state value the number of deaths per 1,000 fire incidents is much higher.
 According to the data from the years 2002 - 2018 the average number of fire-related casualties per year is 1. The highest number of injuries - 3 took place in 2011, and the lowest - 0 in 2002. The data has a constant trend.
The average number of injuries per 1,000 fire incidents is 5. This indicator was the highest - 22 in 2011, and the lowest 0 in 2002. The trend for casualties per 1,000 incidents is increasing. Compared to the state value the number of injuries per 1,000 fire incidents is much lower.
According to the data from the years 2002 - 2018 the average number of fire-related casualties per year is 1. The highest number of injuries - 3 took place in 2011, and the lowest - 0 in 2002. The data has a constant trend.
The average number of injuries per 1,000 fire incidents is 5. This indicator was the highest - 22 in 2011, and the lowest 0 in 2002. The trend for casualties per 1,000 incidents is increasing. Compared to the state value the number of injuries per 1,000 fire incidents is much lower.Casualties per 1,000 incidents in Methuen, MA compared to nearest cities:
(Note: Based on data for all years, including only cities with at least 500 fire incidents)
| Methuen: | 5.0 |
| Lawrence: | 9.8 |
| North Andover: | 5.9 |
| Andover: | 1.0 |
| Haverhill: | 9.9 |
| Dracut: | 10.9 |
| Tewksbury: | 3.2 |
| Lowell: | 5.6 |
| Georgetown: | 11.3 |
 28.7% incidents where reported in the morning and 71.3% in the evening. The most fires (16.9%) took place on Sunday, and the least (13.3%) on Wednesday.
 Based on the 2,588 fire incidents from years 2002 - 2018 most fires (11.6%) took place during April, and the least (6.5%) in February.
 Out of all 45,051 cases reported during the years 2002 - 2018, the most belonged to the categories: Rescue & EMS (64.2%), False Alarm (10.1%), and Hazardous Condition (8.5%).
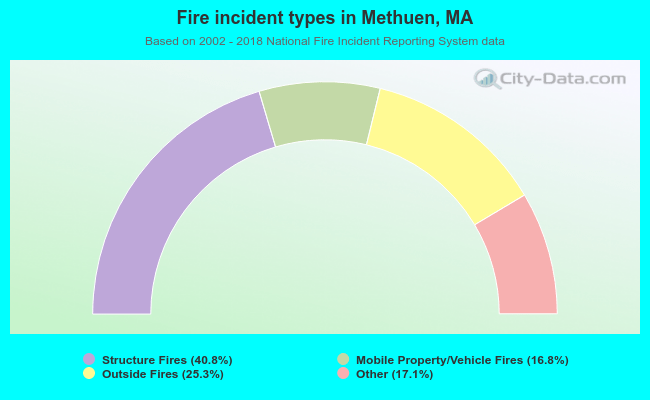 When looking into fire subcategories, the most incidents belonged to: Structure Fires (40.8%), and Outside Fires (25.3%).