Maywood: Fire Incidents, California (CA)
Where are fire incidents reported in Maywood, CA
Something went wrong! Please refresh the page.
|
| |||||||||||||||||||||||||||||||||||||||||||||||||||||||||||||||||||||||||||||||||||||||||||||||||
2005 - 2018 National Fire Incident Reporting System (NFIRS) incidents
- Incident types reported to NFIRS in Maywood, CA
- 4,11967.9%Rescue & EMS
- 90414.9%Good Intent Call
- 4998.2%False Alarm
- 2944.8%Fire
- 1412.3%Hazardous Condition
- 971.6%Service Call
- 90.1%Special Incident
- Fire incident types reported to NFIRS in Maywood, CA
- 11238.1%Outside Fires
- 10636.1%Structure Fires
- 5318.0%Mobile Property/Vehicle Fires
- 237.8%Other
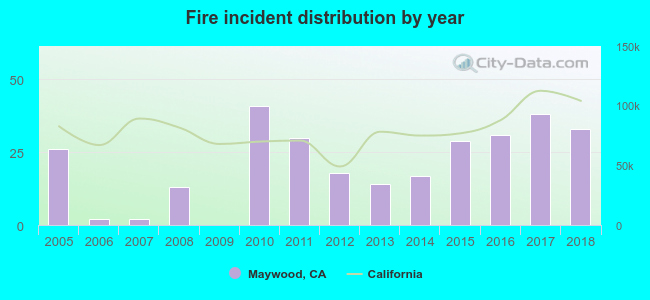 Based on the data from the years 2005 - 2018 the average number of fires per year is 21. The highest number of fires - 41 took place in 2010, and the least - 0 in 2009. The data has a rising trend.
The average number of yearly fire incidents per 10k residents in Maywood, CA compared to nearest cities:
(Note: Based on data for the last 3 years, including only cities with population 5,000 and above)
| Maywood: | 12.2 |
| Bell: | 19.0 |
| Cudahy: | 13.6 |
| Huntington Park: | 19.9 |
| Commerce: | 70.9 |
| Bell Gardens: | 18.3 |
| Walnut Park: | 11.5 |
| South Gate: | 15.8 |
| East Los Angeles: | 17.0 |
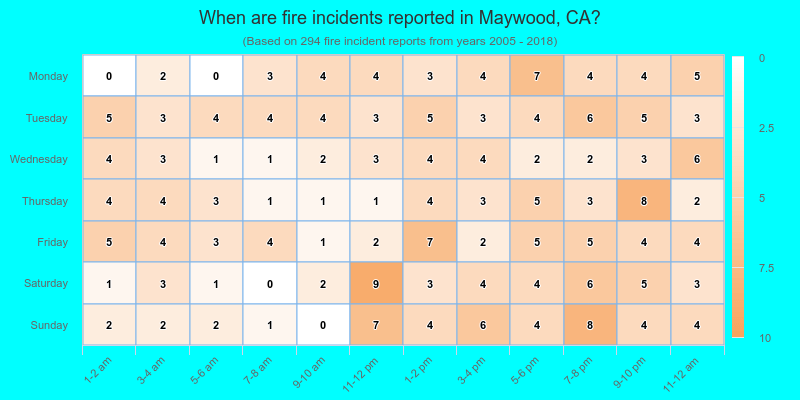
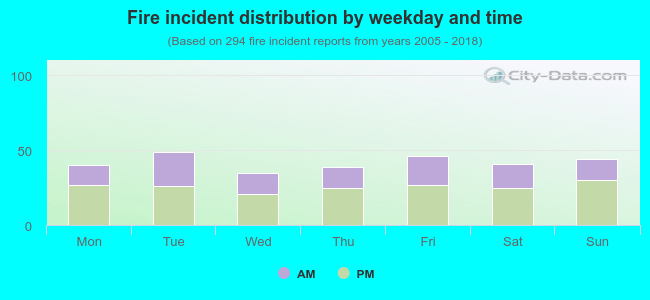 38.4% incidents where reported in the morning and 61.6% in the evening. The most fires (16.7%) took place on Tuesday, and the least (11.9%) on Wednesday.
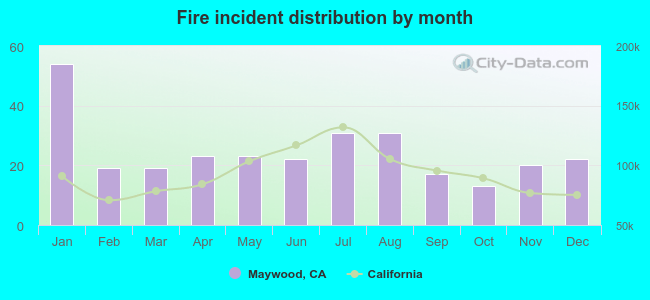 Based on the 294 fire incident reports from years 2005 - 2018 most fires (18.4%) took place during January, and the least (4.4%) in October.
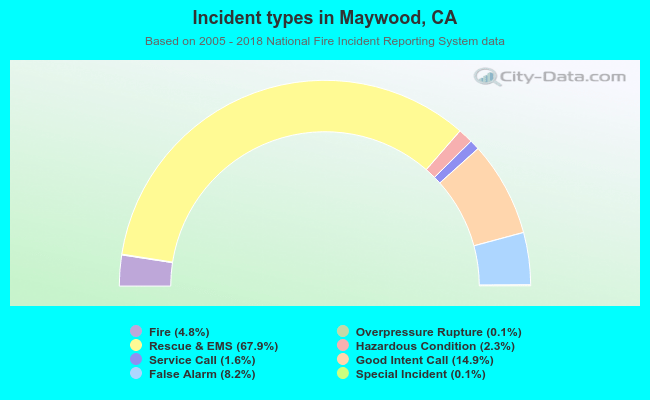 Out of all 6,069 cases reported during the years 2005 - 2018, the most belonged to the categories: Rescue & EMS (67.9%), Good Intent Call (14.9%), and False Alarm (8.2%).
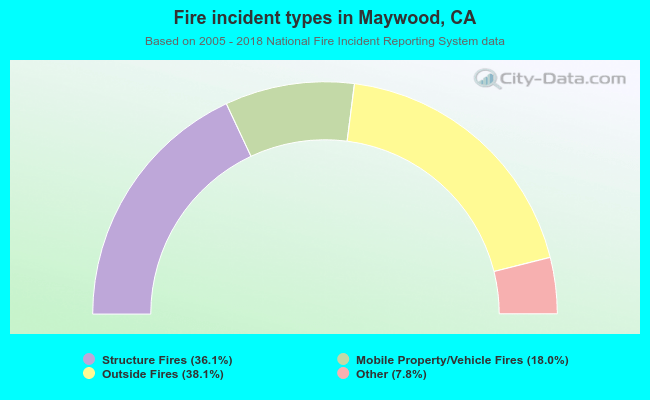 When looking into fire subcategories, the most incidents belonged to: Outside Fires (38.1%), and Structure Fires (36.1%).