Mashpee: Fire Incidents, Massachusetts (MA)
Where are fire incidents reported in Mashpee, MA
Something went wrong! Please refresh the page.
| Fire incidents reported | |
|---|---|
| Sreet name | Count |
| FALMOUTH RD | 94 |
| MAIN ST | 72 |
| NATHAN ELLIS HWY | 56 |
| OLD BARNSTABLE RD | 50 |
| GREAT NECK RD | 46 |
| COTUIT RD | 32 |
| MASHPEE NECK RD | 32 |
| WAMPANOAG DR | 22 |
| INDUSTRIAL DR | 20 |
| MEETINGHOUSE RD | 18 |
| BATES RD | 16 |
| COMMERCIAL ST | 16 |
| GRAFTON POCKNETT RD | 16 |
| ASHERS PATH | 14 |
| GREAT OAK RD | 14 |
| LOWELL RD | 14 |
| QUINAQUISSET AVE | 14 |
| ASHUMET RD | 12 |
| CHARLES ST | 12 |
| GREAT PINES DR | 12 |
| SANTUIT POND RD | 12 |
| SHORE DR | 12 |
| TIMBERLANE DR | 12 |
| WADING PLACE RD | 12 |
| WILLOWBEND DR | 12 |
| JOBS FISHING RD | 10 |
| LAKE AVE | 10 |
| MONOMOSCOY RD | 10 |
| PARK PLACE WAY | 10 |
| SADDLEBACK RD | 10 |
| Other | 246 |
2002 - 2018 National Fire Incident Reporting System (NFIRS) incidents
- Incident types reported to NFIRS in Mashpee, MA
- 10,66758.2%Rescue & EMS
- 2,34412.8%False Alarm
- 1,89010.3%Service Call
- 1,5978.7%Hazardous Condition
- 9385.1%Fire
- 8184.5%Good Intent Call
- 360.2%Special Incident
- Fire incident types reported to NFIRS in Mashpee, MA
- 42745.5%Structure Fires
- 37039.4%Outside Fires
- 12112.9%Mobile Property/Vehicle Fires
- 202.1%Other
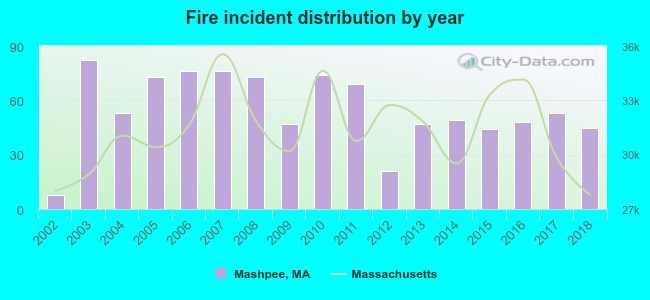 According to the data from the years 2002 - 2018 the average number of fires per year is 55. The highest number of reported fires - 82 took place in 2003, and the least - 8 in 2002. The data has an increasing trend.
The average number of yearly fire incidents per 10k residents in Mashpee, MA compared to nearest cities:
(Note: Based on data for the last 3 years, including only cities with population 5,000 and above)
| Mashpee: | 34.7 |
| East Falmouth: | 53.5 |
| West Yarmouth: | 31.6 |
| Yarmouth: | 2.4 |
| Wareham: | 46.6 |
| Yarmouth Port: | 16.3 |
| South Yarmouth: | 34.9 |
| Mattapoisett: | 32.5 |
| Fairhaven: | 30.2 |
 The median response time based on all reported fire incidents is 7 minutes. This is higher compared to the Massachusetts median value.
The median response time in Mashpee, MA compared to nearest cities:
(Note: Based on data for all years, including only cities with at least 500 fire incidents)
| Mashpee: | 7 minutes |
| Falmouth: | 4 minutes |
| East Sandwich: | 8 minutes |
| Sandwich: | 6 minutes |
| Onset: | 3 minutes |
| Wareham: | 6 minutes |
| South Yarmouth: | 5 minutes |
| Fairhaven: | 3 minutes |
| Harwich: | 6 minutes |
 According to the data from the years 2002 - 2018 the average number of fire-related yearly casualties is 1. The highest number of injuries - 5 took place in 2008, and the lowest - 0 in 2004. The data has an increasing trend.
The average number of casualties per 1,000 fire incidents is 33. This indicator was the highest - 125 in 2002, and the lowest 0 in 2004. The trend for injuries per 1,000 fire incidents is dropping. Compared to the state value the number of casualties per 1,000 fire incidents is much higher.
According to the data from the years 2002 - 2018 the average number of fire-related yearly casualties is 1. The highest number of injuries - 5 took place in 2008, and the lowest - 0 in 2004. The data has an increasing trend.
The average number of casualties per 1,000 fire incidents is 33. This indicator was the highest - 125 in 2002, and the lowest 0 in 2004. The trend for injuries per 1,000 fire incidents is dropping. Compared to the state value the number of casualties per 1,000 fire incidents is much higher.Casualties per 1,000 incidents in Mashpee, MA compared to nearest cities:
(Note: Based on data for all years, including only cities with at least 500 fire incidents)
| Mashpee: | 26.7 |
| Falmouth: | 38.8 |
| East Sandwich: | 29.8 |
| Sandwich: | 18.4 |
| Onset: | 28.4 |
| Wareham: | 25.5 |
| South Yarmouth: | 33.2 |
| Fairhaven: | 25.7 |
| Harwich: | 36.4 |
 29.7% incidents where reported in the morning and 70.3% in the evening. The most fires (17.3%) took place on Saturday, and the least (12.2%) on Friday.
 According to the 938 fires from years 2002 - 2018 most fires (12.9%) took place during April, and the least (5.0%) in October.
 Out of all 18,313 cases reported during the years 2002 - 2018, the most belonged to the categories: Rescue & EMS (58.2%), False Alarm (12.8%), and Service Call (10.3%).
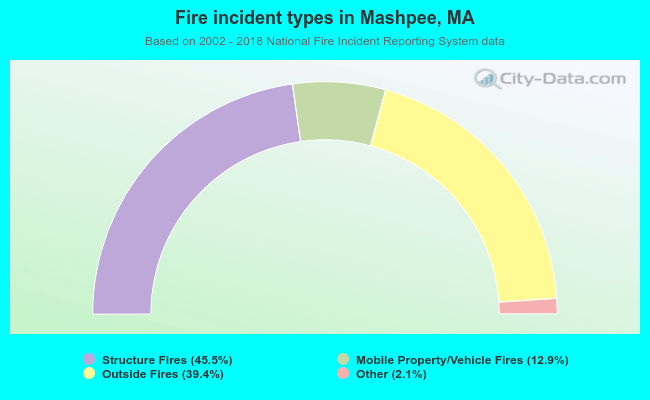 When looking into fire subcategories, the most reports belonged to: Structure Fires (45.5%), and Outside Fires (39.4%).