Marlborough: Fire Incidents, Massachusetts (MA)
Where are fire incidents reported in Marlborough, MA
Something went wrong! Please refresh the page.
| Fire incidents reported | |
|---|---|
| Sreet name | Count |
| BOSTON POST ROAD EAST | 306 |
| MAIN ST | 132 |
| EAST MAIN ST | 128 |
| BOSTON POST ROAD WEST | 118 |
| MAPLE ST | 100 |
| LINCOLN ST | 84 |
| BOLTON ST | 74 |
| WEST MAIN ST | 60 |
| PLEASANT ST | 54 |
| ELM ST | 52 |
| DONALD J LYNCH BLVD | 48 |
| LAKESIDE AVE | 46 |
| BROAD ST | 44 |
| FARM RD | 42 |
| MAIN STREET | 42 |
| ROUTE 495 S | 40 |
| SOUTH BOLTON ST | 38 |
| HOSMER ST | 36 |
| SOUTH BOLTON STREET | 34 |
| BROADMEADOW RD | 32 |
| BRIARWOOD LN | 30 |
| ROUTE 290 EASTBOUND | 30 |
| ROUTE 290 WESTBOUND | 30 |
| ROYAL CREST DR | 30 |
| BOSTON POST RD | 28 |
| BRIGHAM ST | 28 |
| FOREST ST | 28 |
| LINCOLN STREET | 28 |
| ROUTE 495 N | 28 |
| BERLIN RD | 26 |
| Other | 270 |
2002 - 2018 National Fire Incident Reporting System (NFIRS) incidents
- Incident types reported to NFIRS in Marlborough, MA
- 16,74350.5%Rescue & EMS
- 4,96815.0%Hazardous Condition
- 4,20012.7%False Alarm
- 2,8028.5%Service Call
- 2,1586.5%Good Intent Call
- 2,0666.2%Fire
- 1520.5%Special Incident
- Fire incident types reported to NFIRS in Marlborough, MA
- 82239.8%Structure Fires
- 70033.9%Outside Fires
- 34316.6%Mobile Property/Vehicle Fires
- 2019.7%Other
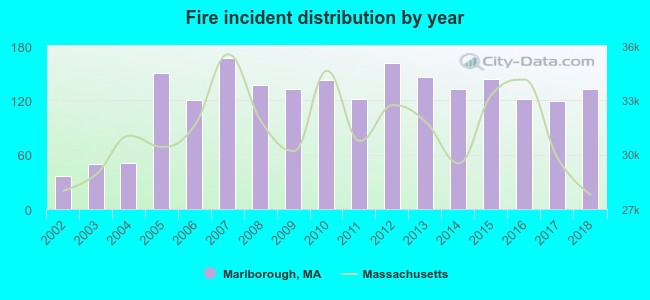 Based on the data from the years 2002 - 2018 the average number of fire incidents per year is 122. The highest number of reported fires - 167 took place in 2007, and the least - 36 in 2002. The data has a rising trend.
The average number of yearly fire incidents per 10k residents in Marlborough, MA compared to nearest cities:
(Note: Based on data for the last 3 years, including only cities with population 5,000 and above)
| Marlborough: | 31.4 |
| Hudson: | 44.1 |
| Southborough: | 38.6 |
| Stow: | 22.8 |
| Northborough: | 77.8 |
| Sudbury: | 15.3 |
| Framingham: | 89.7 |
| Maynard: | 25.7 |
| Ashland: | 30.1 |
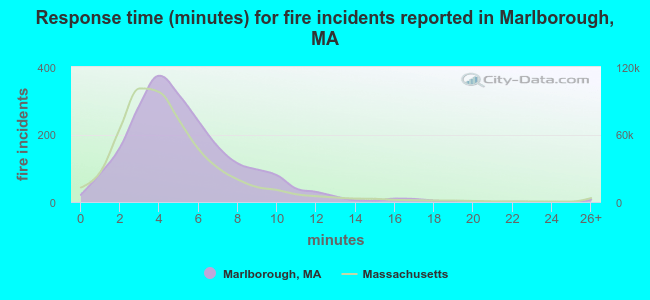 The median response time based on all reported fire incidents is 5 minutes. This is higher than the state median value.
The median response time in Marlborough, MA compared to nearest cities:
(Note: Based on data for all years, including only cities with at least 500 fire incidents)
| Marlborough: | 5 minutes |
| Hudson: | 3 minutes |
| Southborough: | 6 minutes |
| Northborough: | 6 minutes |
| Sudbury: | 4 minutes |
| Westborough: | 5 minutes |
| Framingham: | 4 minutes |
| Clinton: | 3 minutes |
| Hopkinton: | 6 minutes |
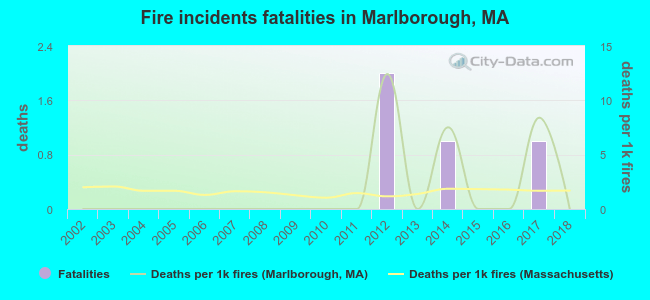 Based on the data from the years 2002 - 2018 the average number of fire-related yearly deaths is 0. The highest number of reported deaths - 2 took place in 2012, and the lowest - 0 in 2002. The data has a constant trend.
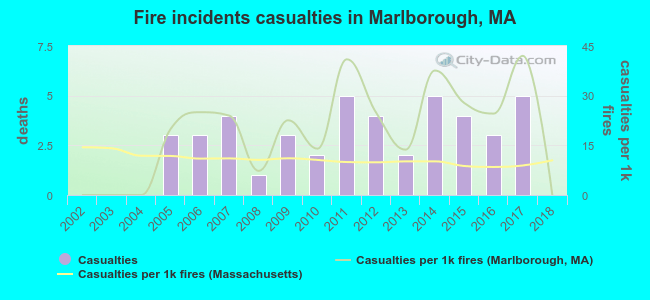 According to the reports from the years 2002 - 2018 the average number of fire-related yearly casualties is 3. The highest number of injuries - 5 took place in 2011, and the lowest - 0 in 2002. The data has a constant trend.
The average number of casualties per 1,000 fires is 19. This indicator was the highest - 42 in 2017, and the lowest 0 in 2002. The trend for casualties per 1,000 fires is increasing. Compared to the Massachusetts value the number of casualties per 1,000 fires is higher.
According to the reports from the years 2002 - 2018 the average number of fire-related yearly casualties is 3. The highest number of injuries - 5 took place in 2011, and the lowest - 0 in 2002. The data has a constant trend.
The average number of casualties per 1,000 fires is 19. This indicator was the highest - 42 in 2017, and the lowest 0 in 2002. The trend for casualties per 1,000 fires is increasing. Compared to the Massachusetts value the number of casualties per 1,000 fires is higher.Casualties per 1,000 incidents in Marlborough, MA compared to nearest cities:
(Note: Based on data for all years, including only cities with at least 500 fire incidents)
| Marlborough: | 21.3 |
| Hudson: | 34.8 |
| Southborough: | 16.8 |
| Northborough: | 18.2 |
| Sudbury: | 8.6 |
| Westborough: | 10.5 |
| Framingham: | 8.3 |
| Clinton: | 5.5 |
| Hopkinton: | 8.7 |
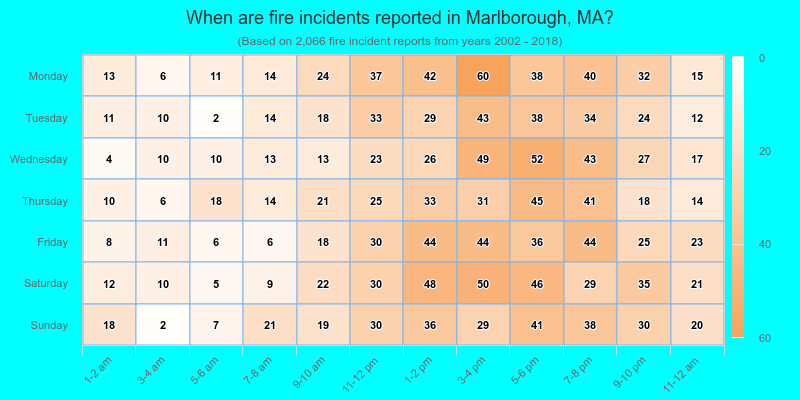
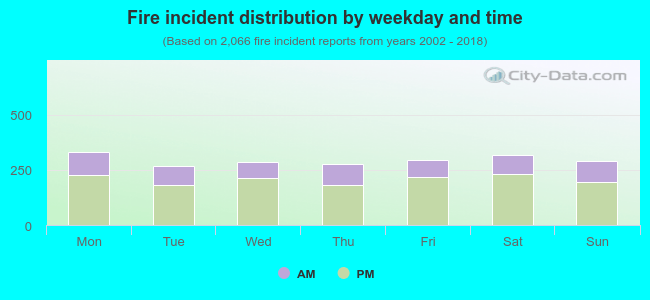 30.2% incidents where reported in the morning and 69.8% in the evening. The most fires (16.1%) took place on Monday, and the least (13.0%) on Tuesday.
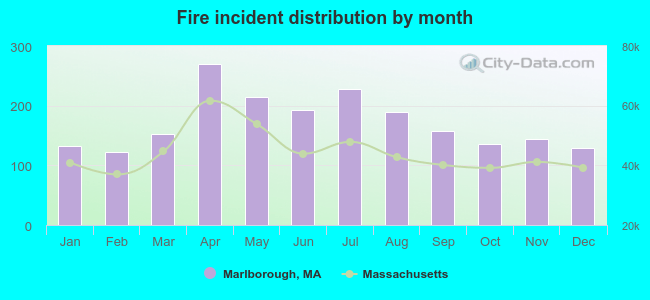 Based on the 2,066 incident reports from years 2002 - 2018 most fires (13.0%) took place during April, and the least (6.0%) in February.
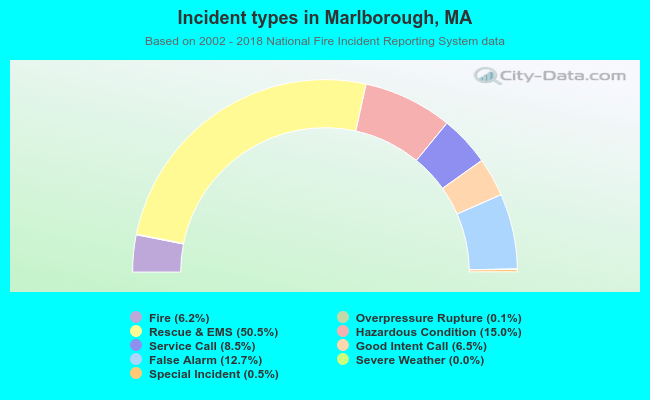 Out of all 33,126 cases reported during the years 2002 - 2018, the most belonged to the categories: Rescue & EMS (50.5%), Hazardous Condition (15.0%), and False Alarm (12.7%).
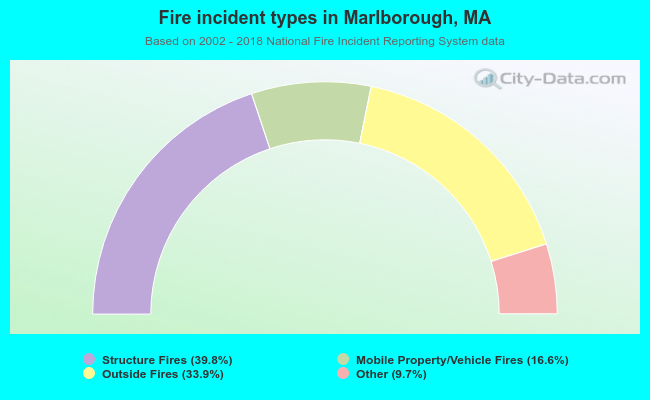 When looking into fire subcategories, the most reports belonged to: Structure Fires (39.8%), and Outside Fires (33.9%).