Marble Falls: Fire Incidents, Texas (TX)
Where are fire incidents reported in Marble Falls, TX
Something went wrong! Please refresh the page.
| Fire incidents reported | |
|---|---|
| Sreet name | Count |
| HWY 281 | 234 |
| 1431 | 88 |
| FM 1431 | 88 |
| HIGHWAY 281 | 32 |
| COMMERCE ST | 30 |
| MAIN ST | 24 |
| FM 1980 | 22 |
| HWY 281 SOUTH | 22 |
| 6TH ST | 20 |
| AVENUE N | 20 |
| HIGHWAY 71 | 20 |
| HWY 71 | 20 |
| MORMON MILL RD | 20 |
| US 281 | 20 |
| 2ND ST | 18 |
| CR 401 | 18 |
| MUSTANG DR | 18 |
| 1ST ST | 16 |
| AVENUE K | 16 |
| BROADWAY ST | 16 |
| FM 2147 | 16 |
| INDUSTRIAL BLVD | 16 |
| JOHNSON ST | 16 |
| STEVE HAWKINS PKY | 16 |
| 4TH ST | 14 |
| AVENUE T | 14 |
| COLT DR | 14 |
| CR 120 | 14 |
| NORTHWOOD DR | 14 |
| PARK VIEW DR | 14 |
| Other | 652 |
2002 - 2018 National Fire Incident Reporting System (NFIRS) incidents
- Incident types reported to NFIRS in Marble Falls, TX
- 5,57550.5%Rescue & EMS
- 1,68115.2%Good Intent Call
- 1,56214.2%Fire
- 1,20710.9%Hazardous Condition
- 6415.8%Service Call
- 2872.6%False Alarm
- 480.4%Special Incident
- 210.2%Severe Weather
- Fire incident types reported to NFIRS in Marble Falls, TX
- 85854.9%Outside Fires
- 46129.5%Structure Fires
- 21413.7%Mobile Property/Vehicle Fires
- 291.9%Other
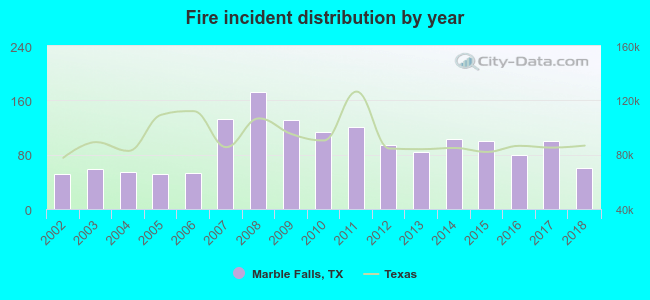 Based on the data from the years 2002 - 2018 the average number of fire incidents per year is 92. The highest number of reported fires - 172 took place in 2008, and the least - 51 in 2005. The data has an increasing trend.
The average number of yearly fire incidents per 10k residents in Marble Falls, TX compared to nearest cities:
(Note: Based on data for the last 3 years, including only cities with population 5,000 and above)
| Marble Falls: | 129.3 |
| Kingsland: | 7.7 |
| Burnet: | 264.5 |
| Lago Vista: | 47.3 |
| Lakeway: | 27.3 |
| Leander: | 38.0 |
| Bee Cave: | 21.8 |
| Cedar Park: | 18.8 |
| Jollyville: | 0.6 |
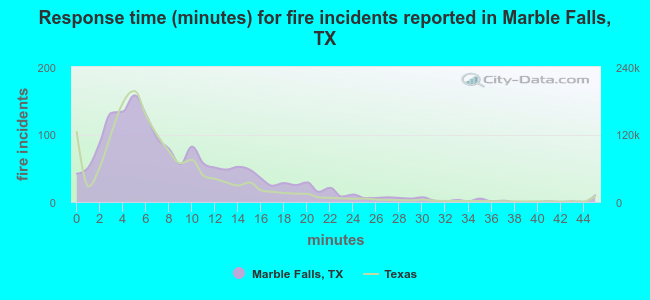 The median response time based on all reported fire incidents is 7 minutes. This is close to the state median value.
The median response time in Marble Falls, TX compared to nearest cities:
(Note: Based on data for all years, including only cities with at least 500 fire incidents)
| Marble Falls: | 7 minutes |
| Burnet: | 8 minutes |
| Bertram: | 9 minutes |
| Liberty Hill: | 10 minutes |
| Leander: | 7 minutes |
| Cedar Park: | 6 minutes |
| Dripping Springs: | 9 minutes |
| Blanco: | 11 minutes |
| Florence: | 10 minutes |
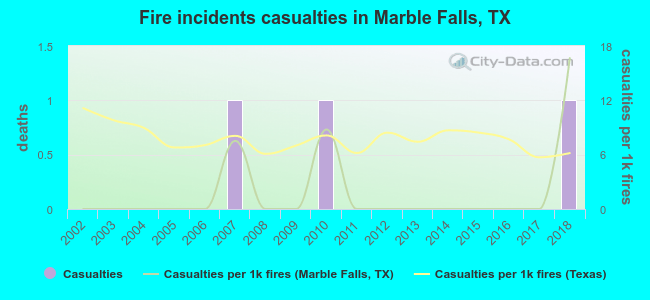 Based on the reports from the years 2002 - 2018 the average number of fire-related yearly casualties is 0. The highest number of injuries - 1 took place in 2007, and the lowest - 0 in 2002. The data has a growing trend.
The average number of injuries per 1,000 fire incidents is 2. This indicator was the highest - 17 in 2018, and the lowest 0 in 2002. The trend for casualties per 1,000 incidents is rising. Compared to the Texas value the number of casualties per 1,000 fires is much lower.
Based on the reports from the years 2002 - 2018 the average number of fire-related yearly casualties is 0. The highest number of injuries - 1 took place in 2007, and the lowest - 0 in 2002. The data has a growing trend.
The average number of injuries per 1,000 fire incidents is 2. This indicator was the highest - 17 in 2018, and the lowest 0 in 2002. The trend for casualties per 1,000 incidents is rising. Compared to the Texas value the number of casualties per 1,000 fires is much lower.Casualties per 1,000 incidents in Marble Falls, TX compared to nearest cities:
(Note: Based on data for all years, including only cities with at least 500 fire incidents)
| Marble Falls: | 1.9 |
| Burnet: | 0.0 |
| Bertram: | 0.0 |
| Liberty Hill: | 0.0 |
| Leander: | 4.2 |
| Cedar Park: | 5.9 |
| Dripping Springs: | 6.2 |
| Blanco: | 1.2 |
| Florence: | 7.4 |
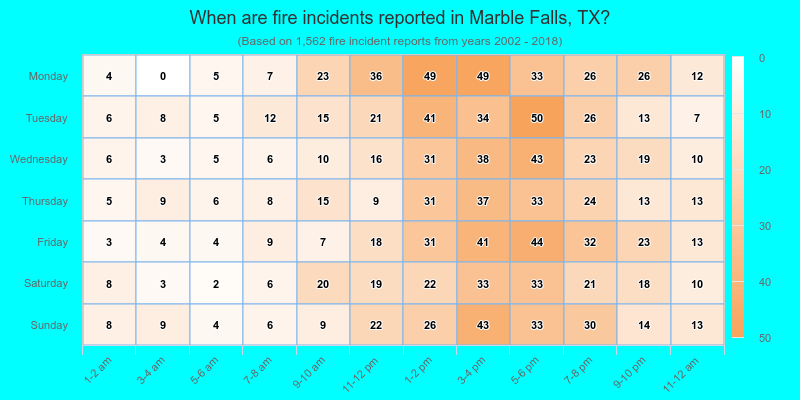
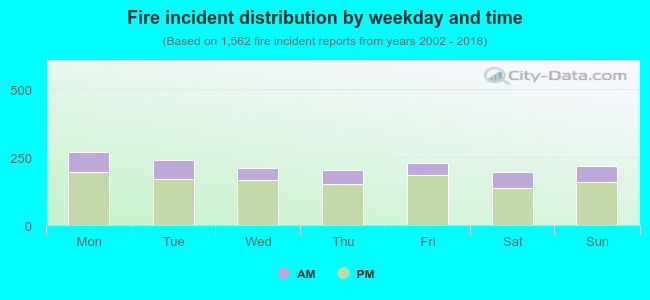 25.7% incidents where reported in the morning and 74.3% in the evening. The most fires (17.3%) took place on Monday, and the least (12.5%) on Saturday.
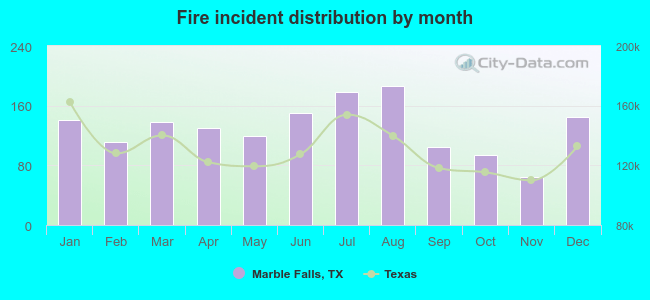 Based on the 1,562 fire incident reports from years 2002 - 2018 most fires (12.0%) took place during August, and the least (4.1%) in November.
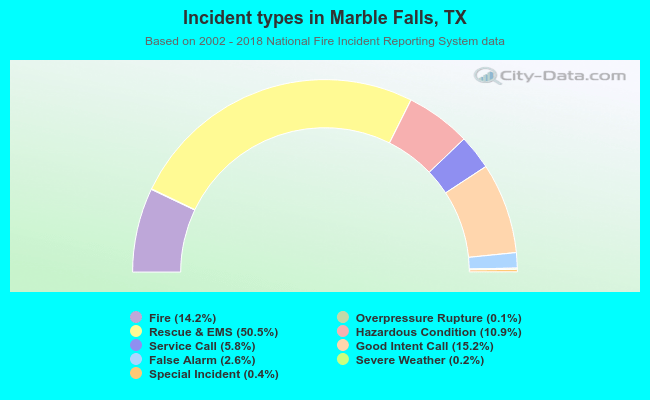 Out of all 11,030 cases reported during the years 2002 - 2018, the most belonged to the categories: Rescue & EMS (50.5%), Good Intent Call (15.2%), and Fire (14.2%).
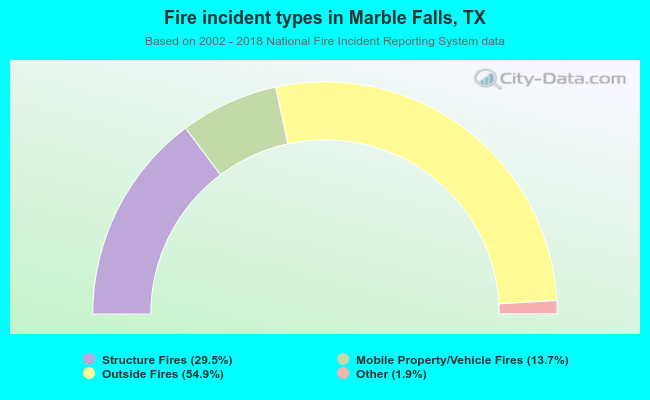 When looking into fire subcategories, the most incidents belonged to: Outside Fires (54.9%), and Structure Fires (29.5%).