Mammoth Lakes: Fire Incidents, California (CA)
Where are fire incidents reported in Mammoth Lakes, CA
Something went wrong! Please refresh the page.
|
| |||||||||||||||||||||||||||||||||||||||||||||||||||||||||||||||||||||||||||||||||||||||||||||||||||||||||||||
2007 - 2018 National Fire Incident Reporting System (NFIRS) incidents
- Incident types reported to NFIRS in Mammoth Lakes, CA
- 33134.1%Rescue & EMS
- 27328.1%Hazardous Condition
- 19520.1%Fire
- 939.6%Good Intent Call
- 464.7%Service Call
- 343.5%False Alarm
- Fire incident types reported to NFIRS in Mammoth Lakes, CA
- 13267.7%Outside Fires
- 4322.1%Structure Fires
- 126.2%Other
- 84.1%Mobile Property/Vehicle Fires
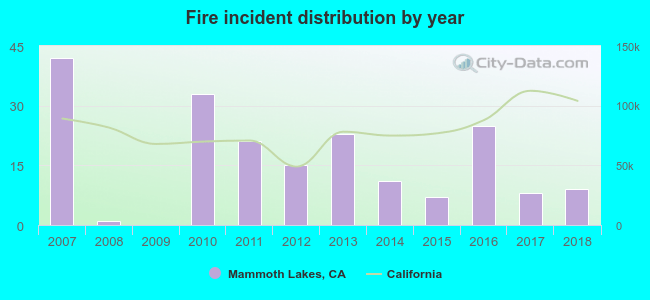 Based on the data from the years 2007 - 2018 the average number of fires per year is 16. The highest number of fire incidents - 42 took place in 2007, and the least - 0 in 2009. The data has a decreasing trend.
The average number of yearly fire incidents per 10k residents in Mammoth Lakes, CA compared to nearest cities:
(Note: Based on data for the last 3 years, including only cities with population 5,000 and above)
| Mammoth Lakes: | 17.5 |
| Clovis: | 32.3 |
| Sanger: | 67.4 |
| Orange Cove: | 121.0 |
| Fresno: | 73.2 |
| Madera Acres: | 1.8 |

 31.8% incidents where reported in the morning and 68.2% in the evening. The most fires (19.5%) took place on Sunday, and the least (7.7%) on Friday.
 Based on the 195 incident reports from years 2007 - 2018 most fires (17.4%) took place during January, and the least (1.5%) in November.
 Out of all 972 cases reported during the years 2007 - 2018, the most belonged to the categories: Overpressure Rupture (34.1%), Rescue & EMS (28.1%), and Fire (20.1%).
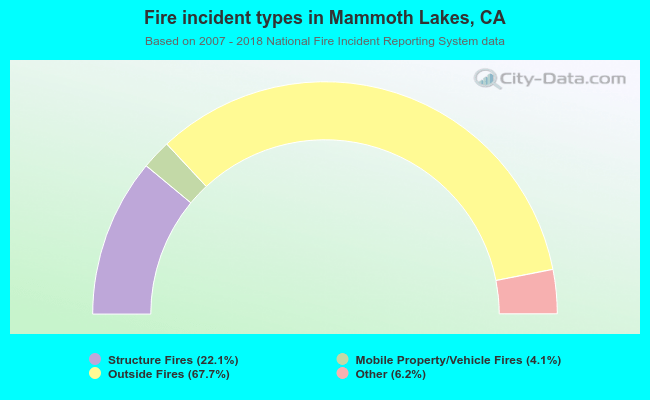 When looking into fire subcategories, the most reports belonged to: Outside Fires (67.7%), and Structure Fires (22.1%).