Malibu: Fire Incidents, California (CA)
Where are fire incidents reported in Malibu, CA
Something went wrong! Please refresh the page.
|
| |||||||||||||||||||||||||||||||||||||||||||||||||||||||||||||||||||||||||||||||||||||||||||||||||||||||||||||
2005 - 2018 National Fire Incident Reporting System (NFIRS) incidents
- Incident types reported to NFIRS in Malibu, CA
- 7,17253.7%Rescue & EMS
- 2,58019.3%Good Intent Call
- 1,2389.3%Service Call
- 9947.4%False Alarm
- 7405.5%Hazardous Condition
- 5444.1%Fire
- 630.5%Special Incident
- 220.2%Overpressure Rupture
- Fire incident types reported to NFIRS in Malibu, CA
- 26548.7%Outside Fires
- 12322.6%Structure Fires
- 8215.1%Mobile Property/Vehicle Fires
- 7413.6%Other
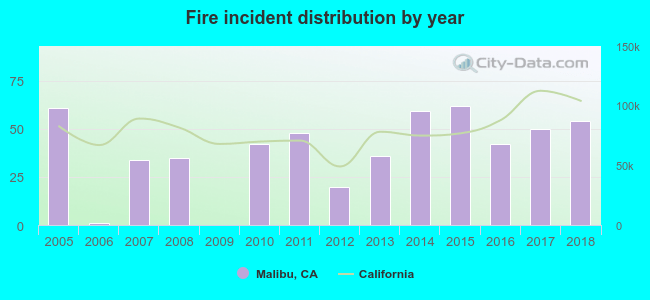 According to the data from the years 2005 - 2018 the average number of fires per year is 39. The highest number of reported fires - 62 took place in 2015, and the least - 0 in 2009. The data has a declining trend.
The average number of yearly fire incidents per 10k residents in Malibu, CA compared to nearest cities:
(Note: Based on data for the last 3 years, including only cities with population 5,000 and above)
| Malibu: | 37.6 |
| Westlake Village: | 9.0 |
| Agoura Hills: | 13.3 |
| Oak Park: | 6.8 |
| Calabasas: | 15.5 |
| Topanga: | 12.9 |
| Thousand Oaks: | 9.7 |
| Simi Valley: | 13.7 |
| Santa Monica: | 23.0 |
 The median response time based on all reported fire incidents is 6 minutes. This is about the same as the California median value.
The median response time in Malibu, CA compared to nearest cities:
(Note: Based on data for all years, including only cities with at least 500 fire incidents)
| Malibu: | 6 minutes |
| Thousand Oaks: | 6 minutes |
| Simi Valley: | 6 minutes |
| Santa Monica: | 5 minutes |
| Moorpark: | 7 minutes |
| Camarillo: | 6 minutes |
| Culver City: | 6 minutes |
| Beverly Hills: | 5 minutes |
| El Segundo: | 5 minutes |
 35.7% incidents where reported in the morning and 64.3% in the evening. The most fires (17.6%) took place on Saturday, and the least (11.4%) on Friday.
 Based on the 544 reports from years 2005 - 2018 most fires (11.2%) took place during November, and the least (5.3%) in December.
 Out of all 13,358 cases reported during the years 2005 - 2018, the most belonged to the categories: Rescue & EMS (53.7%), Good Intent Call (19.3%), and Service Call (9.3%).
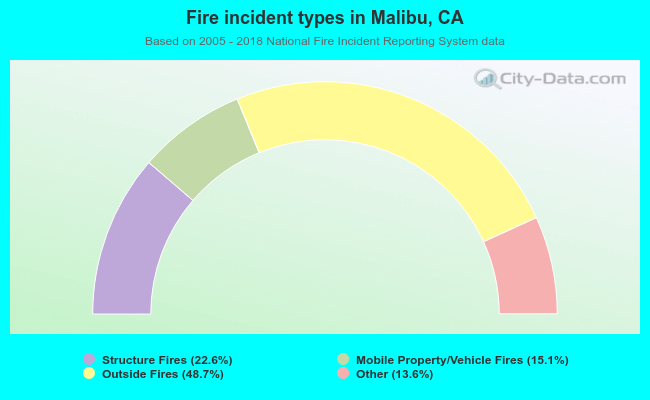 When looking into fire subcategories, the most reports belonged to: Outside Fires (48.7%), and Structure Fires (22.6%).