Lumberton: Fire Incidents, North Carolina (NC)
Where are fire incidents reported in Lumberton, NC
Something went wrong! Please refresh the page.
| Fire incidents reported | |
|---|---|
| Sreet name | Count |
| ROBERTS AVE | 214 |
| 5TH ST | 160 |
| FAYETTEVILLE RD | 148 |
| OLD WHITEVILLE RD | 144 |
| ALAMAC RD | 124 |
| NORMENT RD | 88 |
| 72 HWY | 84 |
| NC 211 HWY | 84 |
| NC72 HWY | 84 |
| LOVETTE RD | 80 |
| ELIZABETHTOWN RD | 78 |
| POPES CROSSING RD | 78 |
| MEADOW RD | 74 |
| RILEY CIR | 74 |
| BARKER TEN MILE RD | 70 |
| OLD ALLENTON RD | 66 |
| SHANNON RD | 66 |
| CHICKEN RD | 64 |
| ODUM RD | 62 |
| WARWICK MILL RD | 60 |
| 05TH ST | 58 |
| PINELOG RD | 58 |
| CARTHAGE RD | 52 |
| KENNY BIGGS RD | 52 |
| LOWE RD | 52 |
| SINGLETARY CHURCH RD | 52 |
| DEEP BRANCH RD | 50 |
| RENNERT RD RD | 48 |
| BEE GEE RD | 46 |
| NC211 HWY | 46 |
| Other | 3,222 |
2002 - 2018 National Fire Incident Reporting System (NFIRS) incidents
- Incident types reported to NFIRS in Lumberton, NC
- 5,76332.7%Rescue & EMS
- 5,63832.0%Fire
- 1,6549.4%Hazardous Condition
- 1,5608.9%False Alarm
- 1,5018.5%Good Intent Call
- 1,3287.5%Service Call
- 1040.6%Special Incident
- 570.3%Overpressure Rupture
- 210.1%Severe Weather
- Fire incident types reported to NFIRS in Lumberton, NC
- 2,89451.3%Outside Fires
- 1,86933.2%Structure Fires
- 64711.5%Mobile Property/Vehicle Fires
- 2284.0%Other
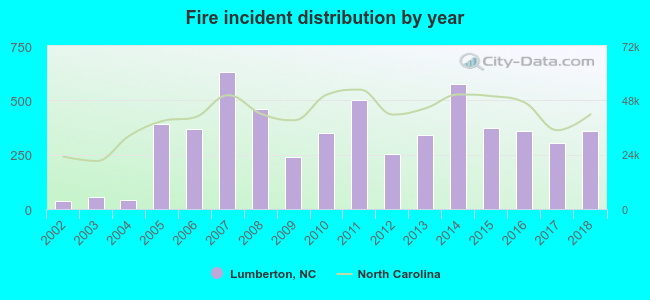 According to the data from the years 2002 - 2018 the average number of fires per year is 332. The highest number of reported fire incidents - 629 took place in 2007, and the least - 36 in 2002. The data has a growing trend.
The average number of yearly fire incidents per 10k residents in Lumberton, NC compared to nearest cities:
(Note: Based on data for the last 3 years, including only cities with population 5,000 and above)
| Lumberton: | 156.6 |
| Hope Mills: | 205.7 |
| Whiteville: | 263.6 |
| Laurinburg: | 99.6 |
| Fayetteville: | 65.8 |
| Fort Bragg: | 0.3 |
| Spring Lake: | 144.1 |
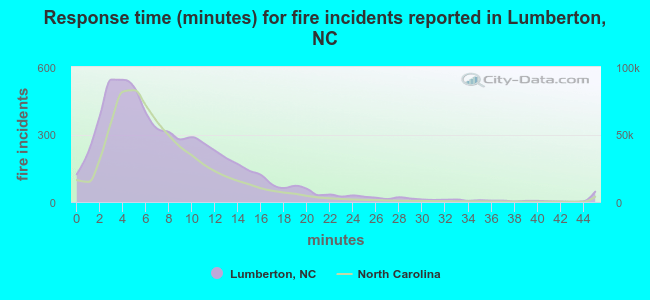 The median response time based on all reported fire incidents is 7 minutes. This is about the same as the state median value.
The median response time in Lumberton, NC compared to nearest cities:
(Note: Based on data for all years, including only cities with at least 500 fire incidents)
| Lumberton: | 7 minutes |
| Fairmont: | 12 minutes |
| Pembroke: | 11 minutes |
| Bladenboro: | 11 minutes |
| Red Springs: | 9 minutes |
| Shannon: | 10 minutes |
| Rowland: | 12 minutes |
| Lumber Bridge: | 10 minutes |
| Parkton: | 9 minutes |
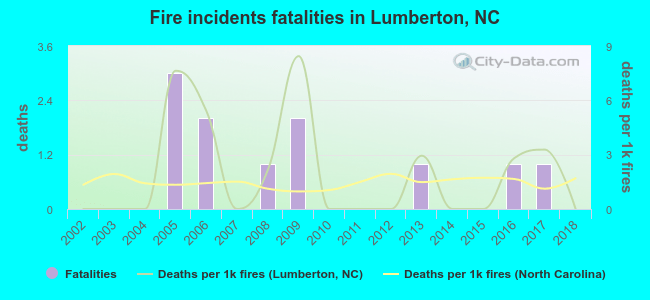 Based on the data from the years 2002 - 2018 the average number of fire-related fatalities per year is 1. The highest number of reported deaths - 3 took place in 2005, and the lowest - 0 in 2002. The data has a constant trend.
The average number of deaths per 1,000 fire incidents is 2. This indicator was the highest - 8 in 2009, and the lowest 0 in 2002. The trend for fatalities per 1,000 fires is declining. Compared to the North Carolina value the number of fatalities per 1,000 fires is higher.
Based on the data from the years 2002 - 2018 the average number of fire-related fatalities per year is 1. The highest number of reported deaths - 3 took place in 2005, and the lowest - 0 in 2002. The data has a constant trend.
The average number of deaths per 1,000 fire incidents is 2. This indicator was the highest - 8 in 2009, and the lowest 0 in 2002. The trend for fatalities per 1,000 fires is declining. Compared to the North Carolina value the number of fatalities per 1,000 fires is higher.Deaths per 1,000 incidents in Lumberton, NC compared to nearest cities:
(Note: Based on data for all years, including only cities with at least 2,500 fire incidents)
| Lumberton: | 2.0 |
| Hope Mills: | 0.7 |
| Raeford: | 0.0 |
| Laurinburg: | 3.1 |
| Fayetteville: | 1.0 |
| Spring Lake: | 0.8 |
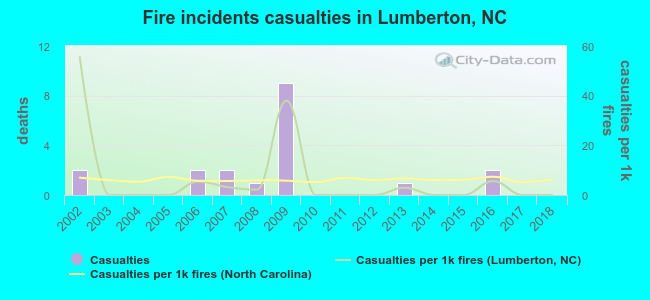 According to the reports from the years 2002 - 2018 the average number of fire-related casualties per year is 1. The highest number of casualties - 9 took place in 2009, and the lowest - 0 in 2003. The data has a decreasing trend.
The average number of casualties per 1,000 fire incidents is 7. This indicator was the highest - 56 in 2002, and the lowest 0 in 2003. The trend for casualties per 1,000 fires is decreasing. Compared to the North Carolina value the number of injuries per 1,000 fire incidents is lower.
According to the reports from the years 2002 - 2018 the average number of fire-related casualties per year is 1. The highest number of casualties - 9 took place in 2009, and the lowest - 0 in 2003. The data has a decreasing trend.
The average number of casualties per 1,000 fire incidents is 7. This indicator was the highest - 56 in 2002, and the lowest 0 in 2003. The trend for casualties per 1,000 fires is decreasing. Compared to the North Carolina value the number of injuries per 1,000 fire incidents is lower.Casualties per 1,000 incidents in Lumberton, NC compared to nearest cities:
(Note: Based on data for all years, including only cities with at least 500 fire incidents)
| Lumberton: | 3.4 |
| Fairmont: | 0.0 |
| Pembroke: | 0.7 |
| Bladenboro: | 0.0 |
| Red Springs: | 1.3 |
| Shannon: | 0.0 |
| Rowland: | 0.0 |
| Lumber Bridge: | 1.6 |
| Parkton: | 0.8 |
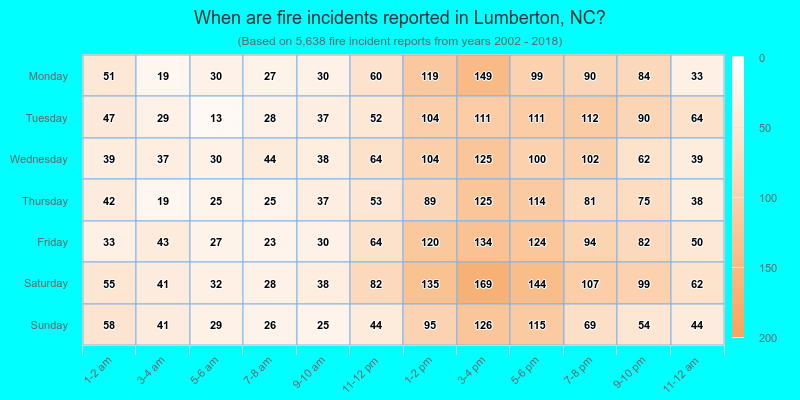
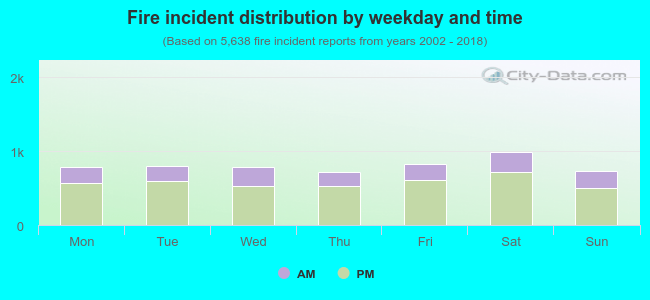 28.3% incidents where reported in the morning and 71.7% in the evening. The most fires (17.6%) took place on Saturday, and the least (12.8%) on Thursday.
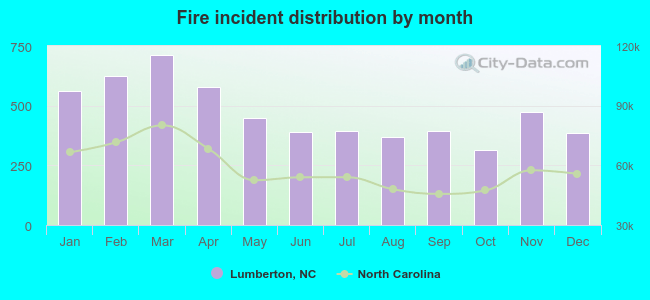 According to the 5,638 fire incident reports from years 2002 - 2018 most fires (12.6%) took place during March, and the least (5.6%) in October.
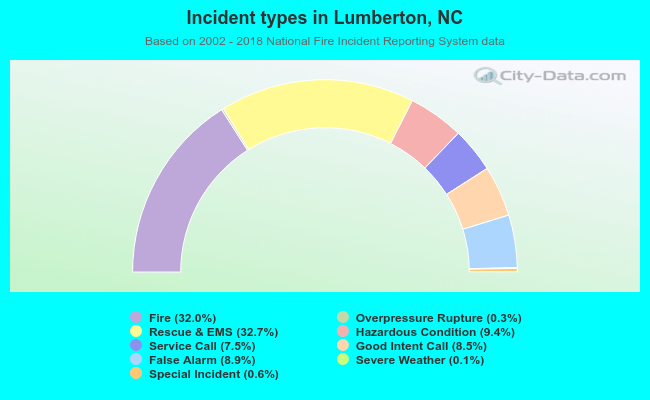 Out of all 17,626 cases reported during the years 2002 - 2018, the most belonged to the categories: Rescue & EMS (32.7%), Fire (32.0%), and Hazardous Condition (9.4%).
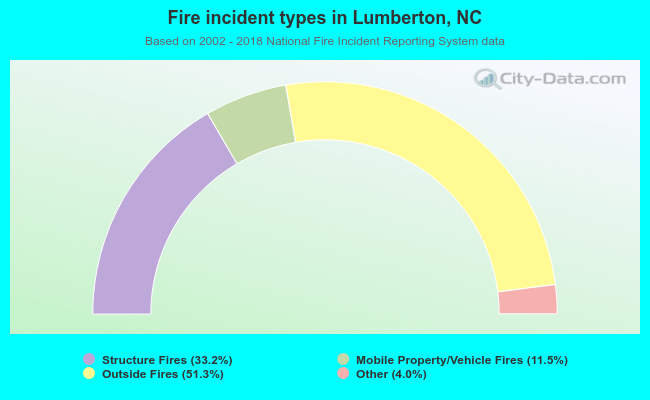 When looking into fire subcategories, the most incidents belonged to: Outside Fires (51.3%), and Structure Fires (33.2%).