Lake Elsinore: Fire Incidents, California (CA)
Where are fire incidents reported in Lake Elsinore, CA
Something went wrong! Please refresh the page.
|
| |||||||||||||||||||||||||||||||||||||||||||||||||||||||||||||||||||||||||||||||||||||||||||||||||||||||||||||
2006 - 2018 National Fire Incident Reporting System (NFIRS) incidents
- Incident types reported to NFIRS in Lake Elsinore, CA
- 23957.2%Rescue & EMS
- 11026.3%Fire
- 215.0%Good Intent Call
- 194.5%False Alarm
- 153.6%Service Call
- 133.1%Severe Weather
- 10.2%Hazardous Condition
- Fire incident types reported to NFIRS in Lake Elsinore, CA
- 6962.7%Outside Fires
- 1816.4%Structure Fires
- 1513.6%Mobile Property/Vehicle Fires
- 87.3%Other
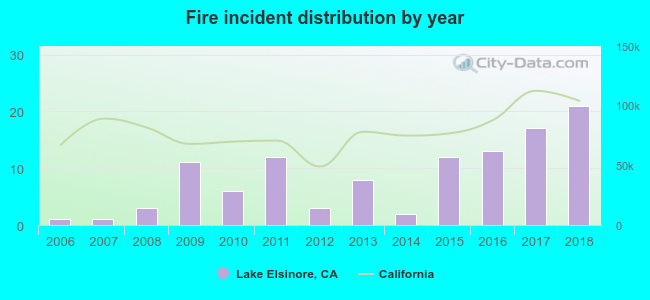 According to the data from the years 2006 - 2018 the average number of fires per year is 8. The highest number of fires - 21 took place in 2018, and the least - 1 in 2006. The data has a growing trend.
The average number of yearly fire incidents per 10k residents in Lake Elsinore, CA compared to nearest cities:
(Note: Based on data for the last 3 years, including only cities with population 5,000 and above)
| Lake Elsinore: | 2.8 |
| Lakeland Village: | 0.9 |
| Canyon Lake: | 1.4 |
| Wildomar: | 0.9 |
| Good Hope: | 1.1 |
| Sun City: | 0.4 |
| Temescal Valley: | 0.9 |
| Perris: | 1.7 |
| Mead Valley: | 0.5 |

 29.1% incidents where reported in the morning and 70.9% in the evening. The most fires (21.8%) took place on Sunday, and the least (7.3%) on Tuesday.
 Based on the 110 fires from years 2006 - 2018 most fires (30.0%) took place during August, and the least (0.9%) in February.
 Out of all 418 cases reported during the years 2006 - 2018, the most belonged to the categories: Overpressure Rupture (57.2%), Fire (26.3%), and Service Call (5.0%).
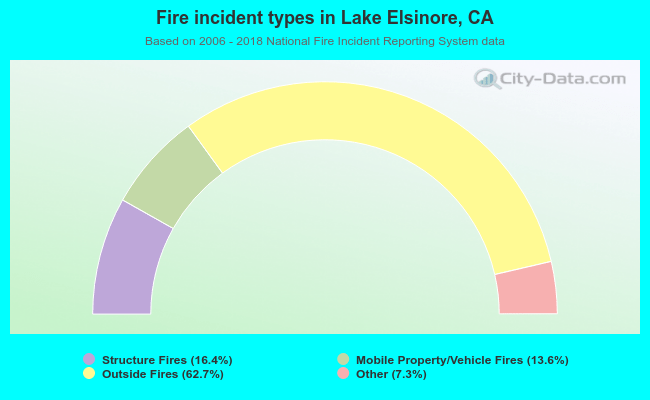 When looking into fire subcategories, the most incidents belonged to: Outside Fires (62.7%), and Structure Fires (16.4%).