Keokuk: Fire Incidents, Iowa (IA)
Where are fire incidents reported in Keokuk, IA
Something went wrong! Please refresh the page.
|
| |||||||||||||||||||||||||||||||||||||||||||||||||||||||||||||||||||||||||||||||||||||||||||||||||||||||||||||
2002 - 2017 National Fire Incident Reporting System (NFIRS) incidents
- Incident types reported to NFIRS in Keokuk, IA
- 2,79852.5%Rescue & EMS
- 74213.9%Service Call
- 67012.6%Fire
- 56210.6%Hazardous Condition
- 2655.0%False Alarm
- 2174.1%Good Intent Call
- 601.1%Special Incident
- 80.2%Overpressure Rupture
- Fire incident types reported to NFIRS in Keokuk, IA
- 26038.8%Structure Fires
- 24536.6%Outside Fires
- 8813.1%Mobile Property/Vehicle Fires
- 7711.5%Other
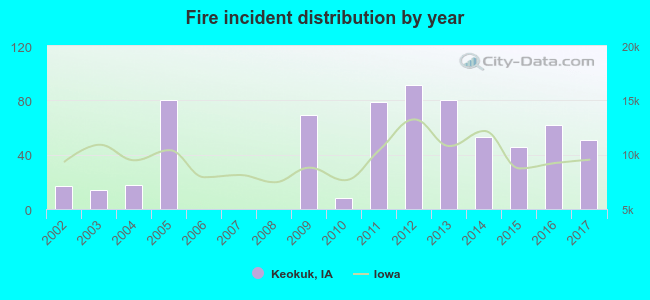 Based on the data from the years 2002 - 2017 the average number of fire incidents per year is 42. The highest number of reported fires - 91 took place in 2012, and the least - 0 in 2006. The data has an increasing trend.
The average number of yearly fire incidents per 10k residents in Keokuk, IA compared to nearest cities:
(Note: Based on data for the last 3 years, including only cities with population 5,000 and above)
| Keokuk: | 35.9 |
| Fort Madison: | 37.6 |
| Burlington: | 38.0 |
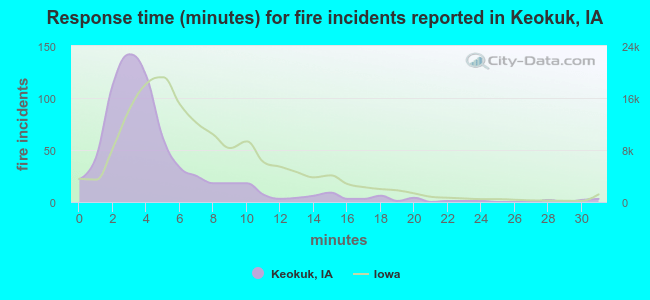 The median response time based on all reported fire incidents is 4 minutes. This is lower than the Iowa median value.
The median response time in Keokuk, IA compared to nearest cities:
(Note: Based on data for all years, including only cities with at least 500 fire incidents)
| Keokuk: | 4 minutes |
| Fort Madison: | 3 minutes |
| Burlington: | 5 minutes |
| Quincy: | 4 minutes |
| Macomb: | 5 minutes |
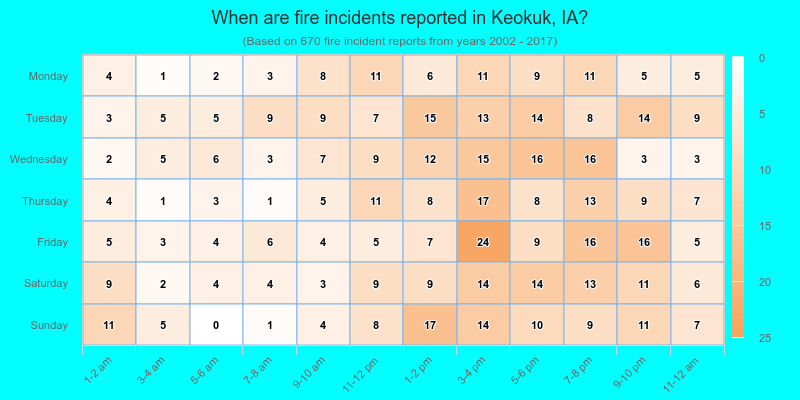
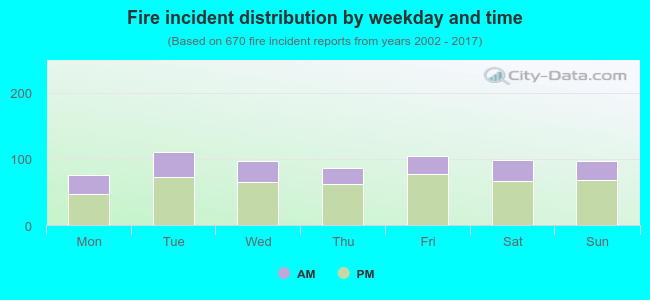 31.5% incidents where reported in the morning and 68.5% in the evening. The most fires (16.6%) took place on Tuesday, and the least (11.3%) on Monday.
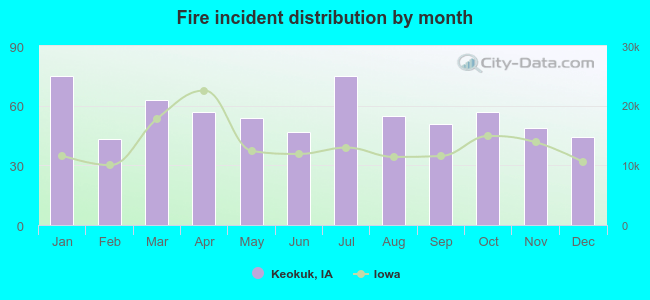 Based on the 670 fires from years 2002 - 2017 most fires (11.2%) took place during January, and the least (6.4%) in February.
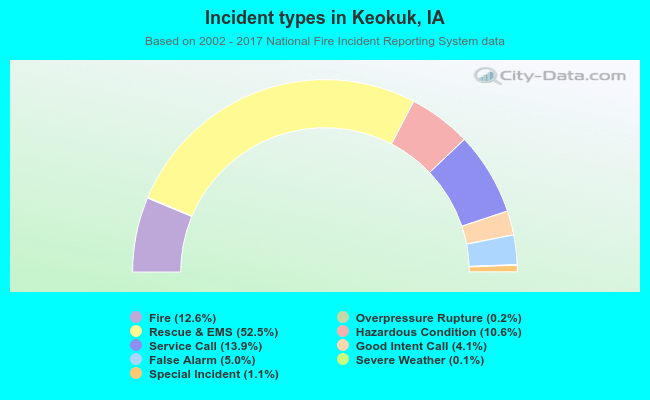 Out of all 5,326 cases reported during the years 2002 - 2017, the most belonged to the categories: Rescue & EMS (52.5%), Service Call (13.9%), and Fire (12.6%).
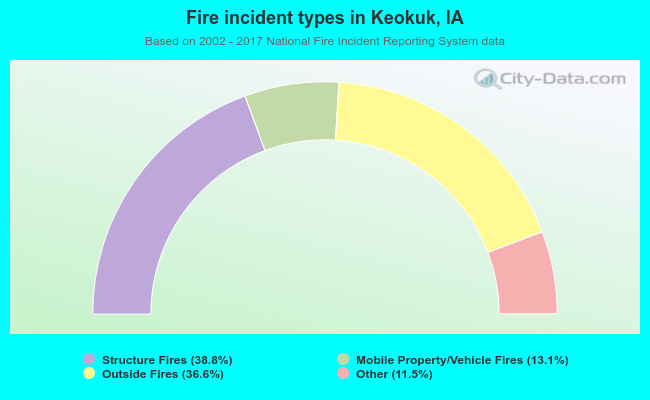 When looking into fire subcategories, the most incidents belonged to: Structure Fires (38.8%), and Outside Fires (36.6%).