Idyllwild: Fire Incidents, California (CA)
Where are fire incidents reported in Idyllwild, CA
Something went wrong! Please refresh the page.
|
| |||||||||||||||||||||||||||||||||||||||||||||||||||||||||||||||||||||||||||||||||||||||||||||||||||||||||||||
2002 - 2018 National Fire Incident Reporting System (NFIRS) incidents
- Incident types reported to NFIRS in Idyllwild, CA
- 2,39572.9%Rescue & EMS
- 2126.5%False Alarm
- 2006.1%Service Call
- 1775.4%Fire
- 1624.9%Hazardous Condition
- 1113.4%Good Intent Call
- 180.5%Special Incident
- 80.2%Overpressure Rupture
- Fire incident types reported to NFIRS in Idyllwild, CA
- 7844.1%Structure Fires
- 6235.0%Outside Fires
- 2313.0%Other
- 147.9%Mobile Property/Vehicle Fires
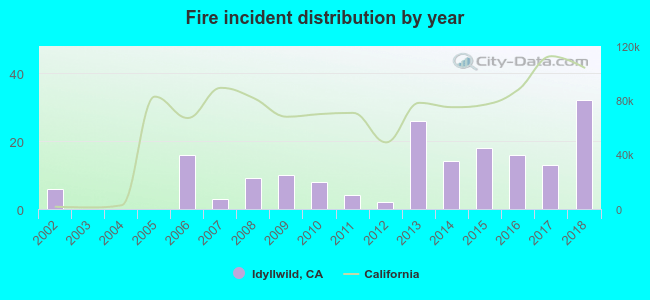 According to the data from the years 2002 - 2018 the average number of fires per year is 10. The highest number of fires - 32 took place in 2018, and the least - 0 in 2003. The data has a rising trend.
The average number of yearly fire incidents per 10k residents in Idyllwild, CA compared to nearest cities:
(Note: Based on data for the last 3 years, including only cities with population 5,000 and above)
| Idyllwild: | 13.0 |
| Valle Vista: | 1.4 |
| Palm Springs: | 39.0 |
| Hemet: | 33.0 |
| Cathedral City: | 30.9 |
| Rancho Mirage: | 1.1 |
| San Jacinto: | 8.0 |
| Palm Desert: | 0.6 |
| Indian Wells: | 1.9 |

 30.5% incidents where reported in the morning and 69.5% in the evening. The most fires (19.2%) took place on Sunday, and the least (8.5%) on Thursday.
 According to the 177 incident reports from years 2002 - 2018 most fires (13.6%) took place during July, and the least (3.4%) in October.
 Out of all 3,286 cases reported during the years 2002 - 2018, the most belonged to the categories: Rescue & EMS (72.9%), False Alarm (6.5%), and Service Call (6.1%).
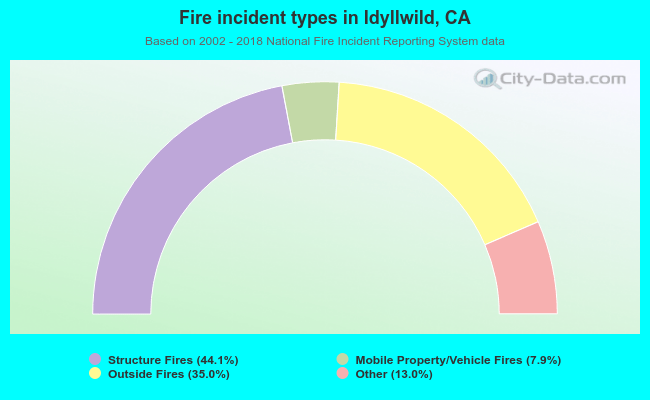 When looking into fire subcategories, the most reports belonged to: Structure Fires (44.1%), and Outside Fires (35.0%).