Henderson: Fire Incidents, Kentucky (KY)
Where are fire incidents reported in Henderson, KY
Something went wrong! Please refresh the page.
| Fire incidents reported | |
|---|---|
| Sreet name | Count |
| GREEN ST | 164 |
| HIGHWAY 41 | 138 |
| MAIN ST | 102 |
| ELM ST | 74 |
| SECOND ST | 72 |
| CLAY ST | 50 |
| POWELL ST | 50 |
| WASHINGTON ST | 50 |
| ZION RD | 50 |
| COMMONWEALTH DR | 48 |
| ALVASIA ST | 40 |
| CENTER ST | 40 |
| FIRST ST | 40 |
| ADAMS ST | 36 |
| ADAMS LN | 34 |
| THIRD ST | 32 |
| GREENRIVER RD | 30 |
| KIMSEY LN | 30 |
| ATKINSON ST | 28 |
| HEILMAN AVE | 26 |
| INGRAM ST | 26 |
| OHIO DR | 26 |
| ALVES ST | 24 |
| BARRET BLVD | 24 |
| FIFTH ST | 24 |
| LETCHER ST | 24 |
| SADDLE BROOK DR | 24 |
| SAND LN | 24 |
| CHERRY ST | 22 |
| COMMUNITY DR | 22 |
| Other | 602 |
2002 - 2018 National Fire Incident Reporting System (NFIRS) incidents
- Incident types reported to NFIRS in Henderson, KY
- 7,54355.2%Rescue & EMS
- 1,97614.5%Fire
- 1,72112.6%Hazardous Condition
- 1,0928.0%False Alarm
- 8216.0%Good Intent Call
- 3962.9%Service Call
- 700.5%Overpressure Rupture
- 420.3%Special Incident
- Fire incident types reported to NFIRS in Henderson, KY
- 84943.0%Outside Fires
- 69335.1%Structure Fires
- 29214.8%Mobile Property/Vehicle Fires
- 1427.2%Other
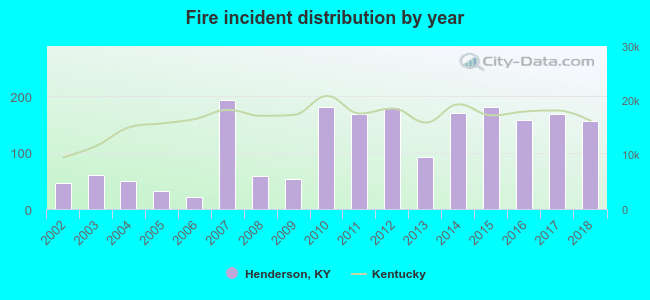 According to the data from the years 2002 - 2018 the average number of fire incidents per year is 116. The highest number of fire incidents - 193 took place in 2007, and the least - 21 in 2006. The data has an increasing trend.
The average number of yearly fire incidents per 10k residents in Henderson, KY compared to nearest cities:
(Note: Based on data for the last 3 years, including only cities with population 5,000 and above)
| Henderson: | 55.7 |
| Spottsville: | 5.4 |
| Owensboro: | 74.6 |
| Madisonville: | 72.7 |
 The median response time based on all reported fire incidents is 4 minutes. This is lower than the Kentucky median value.
The median response time in Henderson, KY compared to nearest cities:
(Note: Based on data for all years, including only cities with at least 500 fire incidents)
| Henderson: | 4 minutes |
| Evansville: | 4 minutes |
| Newburgh: | 7 minutes |
| Boonville: | 5 minutes |
| Owensboro: | 5 minutes |
| Madisonville: | 5 minutes |
| Princeton: | 4 minutes |
| Oakland City: | 5 minutes |
 Based on the reports from the years 2002 - 2018 the average number of fire-related yearly casualties is 1. The highest number of reported casualties - 4 took place in 2011, and the lowest - 0 in 2002. The data has an increasing trend.
The average number of injuries per 1,000 fires is 7. This indicator was the highest - 49 in 2003, and the lowest 0 in 2002. The trend for casualties per 1,000 fire incidents is rising. Compared to the state value the number of casualties per 1,000 fires is about the same.
Based on the reports from the years 2002 - 2018 the average number of fire-related yearly casualties is 1. The highest number of reported casualties - 4 took place in 2011, and the lowest - 0 in 2002. The data has an increasing trend.
The average number of injuries per 1,000 fires is 7. This indicator was the highest - 49 in 2003, and the lowest 0 in 2002. The trend for casualties per 1,000 fire incidents is rising. Compared to the state value the number of casualties per 1,000 fires is about the same.Casualties per 1,000 incidents in Henderson, KY compared to nearest cities:
(Note: Based on data for all years, including only cities with at least 500 fire incidents)
| Henderson: | 8.1 |
| Evansville: | 23.3 |
| Newburgh: | 4.9 |
| Boonville: | 0.0 |
| Owensboro: | 3.5 |
| Madisonville: | 1.4 |
| Princeton: | 15.7 |
| Oakland City: | 0.0 |
 29.5% incidents where reported in the morning and 70.5% in the evening. The most fires (15.7%) took place on Thursday, and the least (13.1%) on Wednesday.
 According to the 1,976 incident reports from years 2002 - 2018 most fires (10.3%) took place during March, and the least (6.9%) in May.
 Out of all 13,669 cases reported during the years 2002 - 2018, the most belonged to the categories: Rescue & EMS (55.2%), Fire (14.5%), and Hazardous Condition (12.6%).
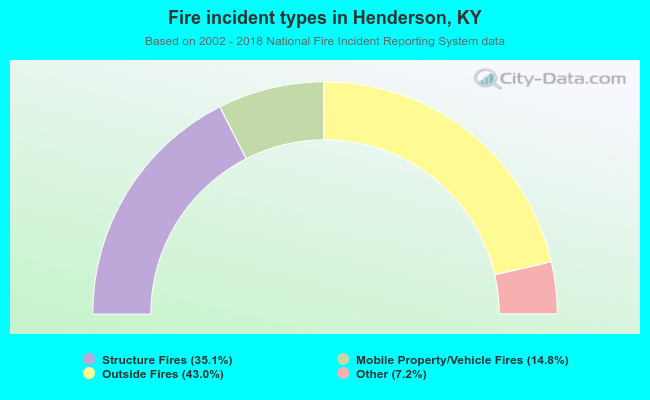 When looking into fire subcategories, the most reports belonged to: Outside Fires (43.0%), and Structure Fires (35.1%).