Hebron: Fire Incidents, Kentucky (KY)
Where are fire incidents reported in Hebron, KY
Something went wrong! Please refresh the page.
|
| |||||||||||||||||||||||||||||||||||||||||||||||||||||||||||||||||||||||||||||||||||||||||||||||||||||||||||||
2003 - 2018 National Fire Incident Reporting System (NFIRS) incidents
- Incident types reported to NFIRS in Hebron, KY
- 1,71529.7%Rescue & EMS
- 1,54926.8%Hazardous Condition
- 77513.4%Fire
- 74012.8%Good Intent Call
- 72612.6%False Alarm
- 2283.9%Service Call
- 220.4%Severe Weather
- 180.3%Overpressure Rupture
- Fire incident types reported to NFIRS in Hebron, KY
- 29137.5%Outside Fires
- 24932.1%Structure Fires
- 19725.4%Mobile Property/Vehicle Fires
- 384.9%Other
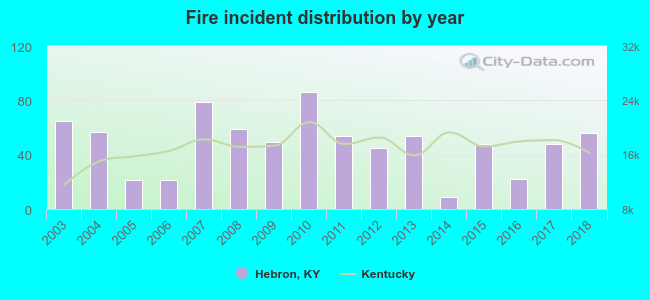 According to the data from the years 2003 - 2018 the average number of fire incidents per year is 48. The highest number of fire incidents - 86 took place in 2010, and the least - 9 in 2014. The data has a decreasing trend.
The average number of yearly fire incidents per 10k residents in Hebron, KY compared to nearest cities:
(Note: Based on data for the last 3 years, including only cities with population 5,000 and above)
| Hebron: | 32.2 |
| Burlington: | 20.1 |
| Villa Hills: | 16.2 |
| Florence: | 68.6 |
| Erlanger: | 44.2 |
| Elsmere: | 33.3 |
| Fort Mitchell: | 26.6 |
| Union: | 36.6 |
| Edgewood: | 17.9 |
 The median response time based on all reported fire incidents is 6 minutes. This is similar to the Kentucky median value.
The median response time in Hebron, KY compared to nearest cities:
(Note: Based on data for all years, including only cities with at least 500 fire incidents)
| Hebron: | 6 minutes |
| Burlington: | 7 minutes |
| Lawrenceburg: | 8 minutes |
| Florence: | 6 minutes |
| Erlanger: | 5 minutes |
| Fort Wright: | 6 minutes |
| Covington: | 4 minutes |
| Newport: | 4 minutes |
| Independence: | 5 minutes |
 29.7% incidents where reported in the morning and 70.3% in the evening. The most fires (16.3%) took place on Wednesday, and the least (11.5%) on Saturday.
 Based on the 775 fire incidents from years 2003 - 2018 most fires (11.4%) took place during September, and the least (4.8%) in December.
 Out of all 5,777 cases reported during the years 2003 - 2018, the most belonged to the categories: Rescue & EMS (29.7%), Hazardous Condition (26.8%), and Fire (13.4%).
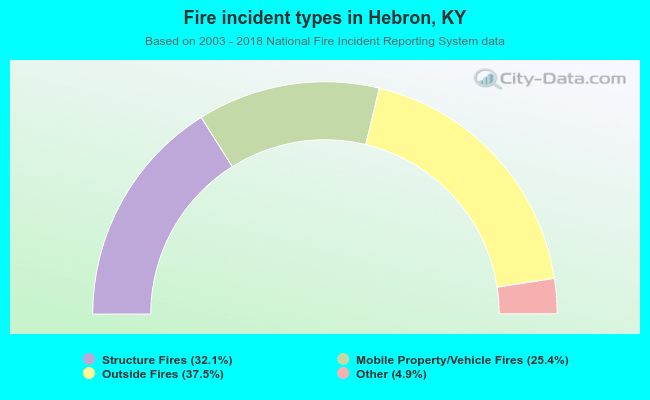 When looking into fire subcategories, the most reports belonged to: Outside Fires (37.5%), and Structure Fires (32.1%).