Hacienda Heights: Fire Incidents, California (CA)
Where are fire incidents reported in Hacienda Heights, CA
Something went wrong! Please refresh the page.
|
| |||||||||||||||||||||||||||||||||||||||||||||||||||||||||||||||||||||||||||||||||||||||||||||||||||||||||||||
2005 - 2018 National Fire Incident Reporting System (NFIRS) incidents
- Incident types reported to NFIRS in Hacienda Heights, CA
- 9,37764.9%Rescue & EMS
- 2,66118.4%Good Intent Call
- 7565.2%False Alarm
- 6384.4%Fire
- 5303.7%Hazardous Condition
- 4553.2%Service Call
- 180.1%Special Incident
- Fire incident types reported to NFIRS in Hacienda Heights, CA
- 22835.7%Outside Fires
- 18629.2%Structure Fires
- 17527.4%Mobile Property/Vehicle Fires
- 497.7%Other
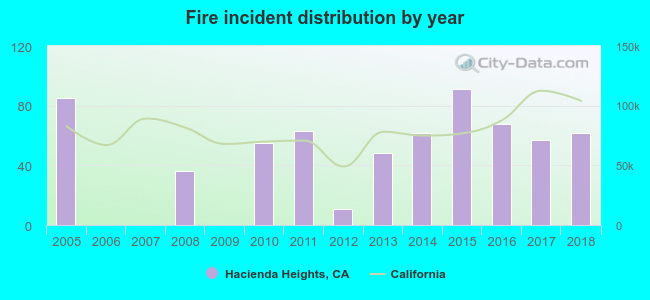 According to the data from the years 2005 - 2018 the average number of fires per year is 46. The highest number of fire incidents - 91 took place in 2015, and the least - 0 in 2006. The data has a decreasing trend.
The average number of yearly fire incidents per 10k residents in Hacienda Heights, CA compared to nearest cities:
(Note: Based on data for the last 3 years, including only cities with population 5,000 and above)
| Hacienda Heights: | 11.5 |
| La Puente: | 8.3 |
| La Habra Heights: | 18.9 |
| Valinda: | 10.2 |
| Whittier: | 11.9 |
| Rowland Heights: | 6.5 |
| West Covina: | 5.2 |
| La Habra: | 10.7 |
| South El Monte: | 26.1 |
 The median response time based on all reported fire incidents is 6 minutes. This is comparable to the California median value.
The median response time in Hacienda Heights, CA compared to nearest cities:
(Note: Based on data for all years, including only cities with at least 500 fire incidents)
| Hacienda Heights: | 6 minutes |
| Industry: | 6 minutes |
| Whittier: | 4 minutes |
| West Covina: | 6 minutes |
| La Habra: | 5 minutes |
| Baldwin Park: | 5 minutes |
| El Monte: | 4 minutes |
| Pico Rivera: | 5 minutes |
| Santa Fe Springs: | 7 minutes |
 34.5% incidents where reported in the morning and 65.5% in the evening. The most fires (16.5%) took place on Monday, and the least (11.8%) on Tuesday.
 According to the 638 fires from years 2005 - 2018 most fires (13.5%) took place during July, and the least (5.6%) in August.
 Out of all 14,443 cases reported during the years 2005 - 2018, the most belonged to the categories: Rescue & EMS (64.9%), Good Intent Call (18.4%), and False Alarm (5.2%).
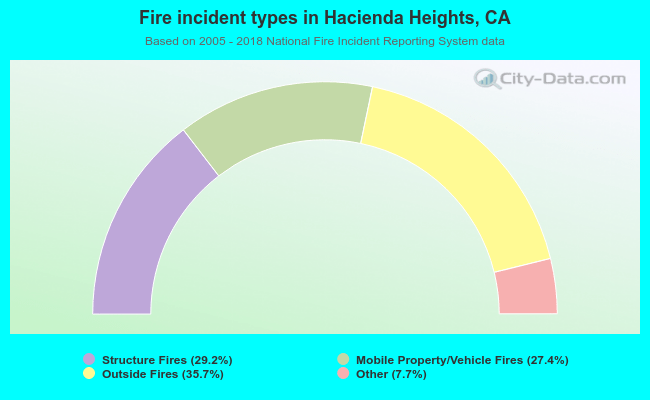 When looking into fire subcategories, the most incidents belonged to: Outside Fires (35.7%), and Structure Fires (29.2%).